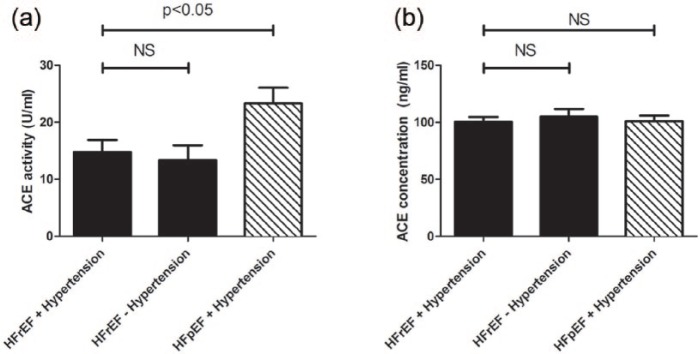
Figure 3.
Comparisons of serum ACE activities and serum ACE concentrations between heart failure cohorts.
Serum ACE activity (panel (a)) and ACE concentration (panel (b)) were measured in hypertensive patients with heart failure with reduced ejection fraction (HFrEF, n=102), hypertensive patients with heart failure with preserved ejection fraction (HFpEF, n=47) and patients with HFrEF without hypertension (n=39). Statistical analyses of biochemical measurements were performed by one-way analysis of variance (ANOVA) followed by nonparametric Kruskal–Wallis test among groups. Bars represent mean ± SEM. Correlation was considered to be significant when p<0.05. Lack of statistical difference is labelled by NS.

