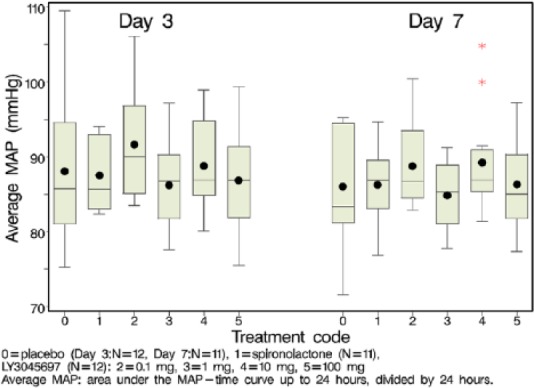
Figure 1.

Mean arterial pressure (MAP) at various time points, post-dose, on Day 3 and Day 7. Mean (dot); median (center line within box); 25th and 75th percentiles as edges of the box; whiskers extend as far as the data extend to a distance of at most 1.5 interquartile range (IQR).
P = placebo (Day 3; N=12, Day 7; N=11), S = spironolactone (N=11), L = LY3045697 (N=12); Average MAP: area under the MAP – time curve up to 24 hours, divided by 24 hours.
