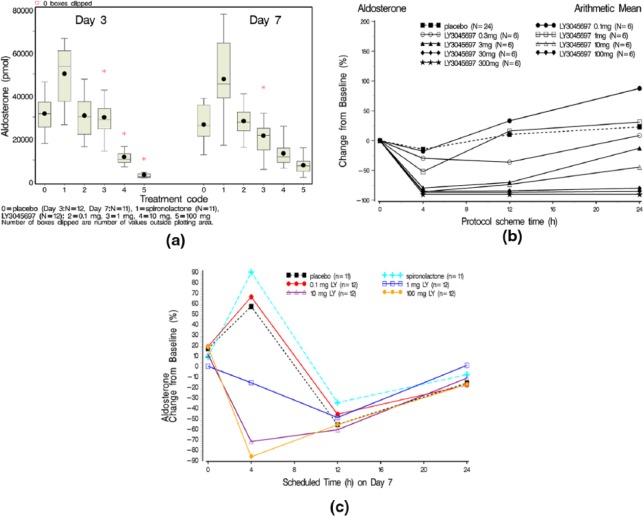
Figure 3.
(a) Box and whisker plot of the amount of aldosterone excreted in urine after 24 h collection on Day 3 and Day 7 by treatment (after a single dose). Mean (dot); median (center line within box); 25th and 75th percentiles as edges of the box; whiskers extend as far as the data extend to a distance of at most 1.5 interquartile range (IQR); (b) Mean percent (%) change from baseline for plasma aldosterone versus time from dosing by treatment after a single dose administration; (c) Arithmetic mean percentage change from Baseline versus time profiles on Day 7 for plasma aldosterone after multiple daily dose administration.

