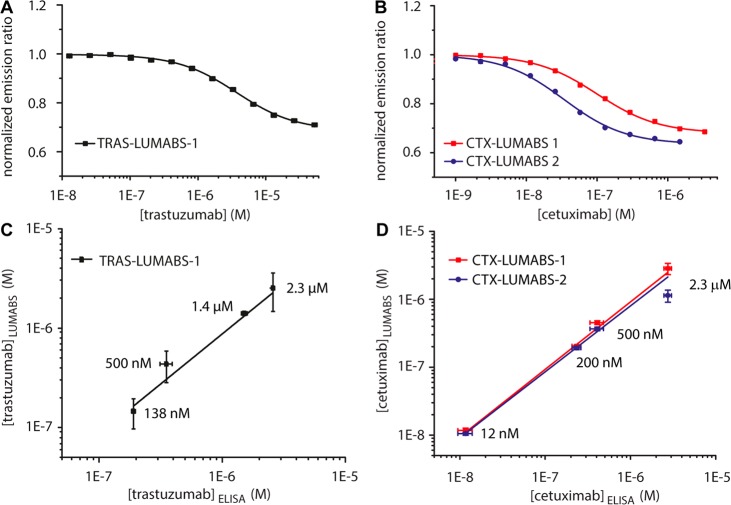
Figure 4.
Performance of TRAS-LUMABS and CTX-LUMABS assays in blood plasma. (A,B) Calibration of TRAS-LUMABS-1 (A) and CTX-LUMABS-1 and -2 (B) in 90% plasma. Error bars represent mean ± SD from three measurements of the same calibration sample. (C,D) Correlation of antibody concentrations measured by ELISA and by TRAS-LUMABS-1 (C) or CTX-LUMABS-1 and -2 (D). Concentrations were calculated from each measurement using the calibration curve. Error bars represent mean ± SD of these concentrations.

