Abstract
Background:
The presence of air pollutants such as CO, NO2, SO2, O3, and PM in the ambient air mainly emitted from fossil fuels combustion has become a major health concern. The aims of this study were to estimate the attribution of NO2, SO2, and O3 in the premature deaths and prevalence of cardiovascular and respiratory diseases in Isfahan in 2013–2014.
Methods:
In this study, short-term health effects (total mortality, cardiovascular and respiratory mortality, chronic obstructive pulmonary disease, and acute myocardial infarction) of exposure NO2, SO2, and O3 on the population of Isfahan were assessed using AirQ 2.2.3 software suggested by the World Health Organization (WHO).
Results:
The result showed that from nonaccident total mortality in 2013–2014 in Isfahan, the attributable proportion related to NO2, SO2, and O3 were 1.03% (109 cases), 3.46% (365 cases), and 1.29% (136 cases), respectively. The percentage of days that people were exposed to the highest concentration of NO2 (40–49 μg/m3), SO2 (60–69 μg/m3), and O3 (40–49 μg/m3) was 34.46%, 16.85%, and 42.74% of a year, respectively. Total mortality attributed to NO2, SO2, and O3 exposure was 0.36%, 0.79%, and 0.83%, respectively.
Conclusions:
The concentrations of NO2 and SO2 were upper than the WHO guidelines. The Air-Q software in spite of its limitations can provide useful information regarding the health outcome of the air pollutants. The results estimated in this study were considerable. This information can help the health authorities and policy makers to draw suitable strategies and fulfill effective emission control programs.
Keywords: Air pollution, AirQ software, mortality, NO2, SO2, O3
Introduction
Today, industrialization, urbanization, and population growth are causing environmental pollution.[1] Health effects of acute (short-term) and chronic (long-term) air pollution were increased in the 20th century.[2] Concerns about the effects of air pollutants on human health, are exist in both developed and developing countries.[3,4] Although the presence of air pollutants in trace concentrations and less than standard limit may have not harmful effects on public health, that can be harmful to sensitive population groups.[3,5] In the recent two decades, epidemiological studies have shown that outdoor air pollution causes diseases such as cardiovascular and respiratory problems, lung function decreased, chronic bronchitis, and death.[6] The result of several studies on short- and long-term effects of the air pollutants showed an increase in hospital admission, number of specific disease cases, death and lost years of life.[7]
According to the World Health Organization (WHO) report, more than 6 million premature deaths, each year can be attributed to outdoor and indoor air pollution.[8] It was estimated that in Austria, France, and Switzerland air pollution causes 40,000 premature deaths.[9] In Russian Federation, about 4% of the total mortality is attributed to air pollution.[10] A Swedish study has shown that exposure to ambient particulate matter could cause annually almost 4700 premature deaths in cities and 600 in the countryside of Sweden.[11]
A study in Taiwan has shown a correlation between the increased concentration of NO2 in the air and increased hospital admissions due to heart attacks, chronic obstructive pulmonary disease (COPD), and asthma.[12] Another study by Zallaghi et al. Tabriz showed an increase in NO2 concentrations in urban air affects the health of citizens.[6] Primary standards of SO2 (24-h), NO2 (annual), and O3 (8-h) in the ambient air recommended by WHO are 20, 40, and 100 μg/m3, respectively.[13]
The presence of numerous vehicles in the city of Isfahan and large industries in the suburb area are caused serious air pollution increasing the health risk for residences. However, there is still scarce information to show the association between air pollutants and mortality increase in the city. The aim of this study was to evaluate mortality and morbidity attributed to NO2, SO2, and O3 exposure in Isfahan citizens using the AirQ software (WHO).
Methods
Study area
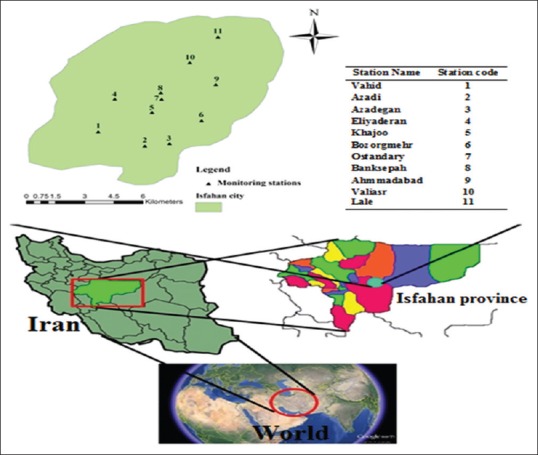
Isfahan city, the capital of Isfahan province, with a population of more than 1.7 million is the third most populous city of Iran located in the center of Iran with an area of 493.8 km2. Isfahan has been situated in longitude 59°39′E, and latitude 32°38′N with a height of 1570 meters above sea level[14,15] life expectancy for men and women in Isfahan is 82.52 and 79.9 years, respectively.[16] Figure 1 shows the map of the study area and locations of monitoring stations.
Figure 1.

Map of the study area and locations of the air pollution monitoring stations (Isfahan, Iran)
AirQ 2.2.3 software
The WHO software tool AirQ performs calculations that allow quantification of the health effects of exposure to air pollution, including estimates of the reduction in life expectancy. AirQ estimates the effects of long-term exposures (using life-tables approach and based on risk estimates from cohort studies). It can be used to estimate a particular health effect (total mortality, morbidity, hospital admissions) attributable to selected air pollutants and the change in health effects if air pollution levels changed in the future.
This software correlates air quality data in various ranges of concentration with epidemiological parameters such as relative risk (RR), baseline incidence (BI in 105 people), and attributable proportion (AP), and show its results as mortality. The AP in this software is calculated according to the following formula:
AP = Sum {[RR(c) – 1] × p(c)}/Sum [RR(c) − 1]
Where, RR (c) is the RR of health outcome in the target group, (c) is the population proportion of the target group.
By knowing the amount of BI in the target population, we can calculate the attributed value to population contract (IE) by the following formula:
IE = BI × AP
where IE is the amount of health effect attributable to the exposure, and I is the baseline frequency of the health effect in the target population. Finally, the number of cases attributable to the exposure (NE) can be estimated by the following equation by knowing the size of population (N).[2,17,18]
NE = IE × N
RR reflects the rate of a pollutant's impact on the health by a change in the pollutant's concentration. RR is obtained through time-series studies that evaluate the concentration changes of air pollutants and their effects on health during a long time period.[3]
Air pollution data and exposure assessment
There are 11 air pollution monitoring stations in the Isfahan city. One year data (from April 2013 to March 2014) of monitoring stations for SO2, NO2, and O3 concentrations were obtained from the Isfahan Department of Environment. Based on the WHO guideline, some of the monitoring stations’ data were excluded from the study because of their inadequate information. Finally, for the pollutants NO2, SO2, and O3 8, 7, and 4 stations were used, which were active throughout April 2013 to March 2014 and approximately covered whole the city. The air pollution data (NO2, SO2, and O3) was filtered and processed by Excel software according to the WHO guideline to enter into the AirQ software. With regard to the temperature and pressure in the study area, the pollutants concentrations were converted from ppb to μg/m3 and classified with range intervals of 10 μg/m3. The number of exposure days for each of the pollutants at specified intervals, as well as the annual and seasonal mean, maximum annual and seasonal and 98th percentile of pollutants, was calculated to enter into the software. The daily average was used for NO2 and SO2, and 1-h average “moving average” was utilized for O3 concentration. The BI of the total deaths and deaths attributed to cardiovascular and respiratory diseases were estimated using death and diseases data obtained from the health center of Isfahan province. In case of needs for other epidemiological parameters which were not available for the city, the WHO calculated values were applied. Finally, these data were entered into the AirQ software according to the WHO guideline and parameters such as AP, IE, and NE related to SO2, NO2, and O3 were calculated.
Results
Table 1 demonstrates the annual mean, minimum, and maximum NO2, SO2, and O3 concentrations in monitoring stations of the city. The highest average concentration of NO2, SO2, and O3 was related to the Bank Sepah (Keshavarz Street), Azadi and Ahmadabad station, respectively.
Table 1.
Summary of the ambient NO2, SO2 and O3 concentrations (μg/m3) in Isfahan (2013-2014)

The metrological parameters in Isfahan during the study are shown in Table 2. The annual averages of relative humidity (%), precipitation (mm), temperature (°C), and pressure (mbar) were 40.06%, 6.04 mm, 16.75°C, and 852.28 mbar, respectively.
Table 2.
Summary of meteorological variable in Isfahan (2013-2014)

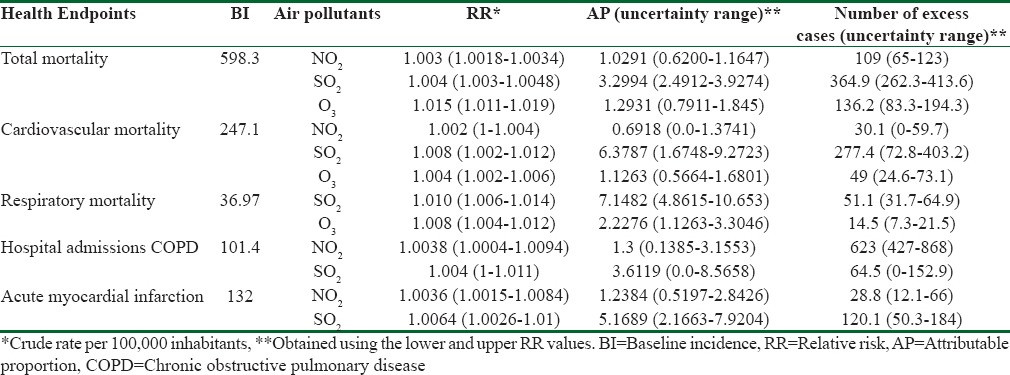
Table 3 displays the BI, RR, AP, and the number of deaths, mortality of cardiovascular and respiratory diseases, hospital admission due to COPD and acute myocardial infarction attributable to SO2, NO2, and O3 in the various ranges of RR.
Table 3.
Estimated relative risk with 95% confidence interval, attributable proportion percentage and number of excess cases in a year due to short-term exposure to SO2, NO2 and O3

The estimated values using AirQ software gives uncertainty ranges because the characteristics of target population vary based on epidemiological studies. However, these estimates give policymakers valuable information and encourage them to focus on effective air pollution control scenarios.
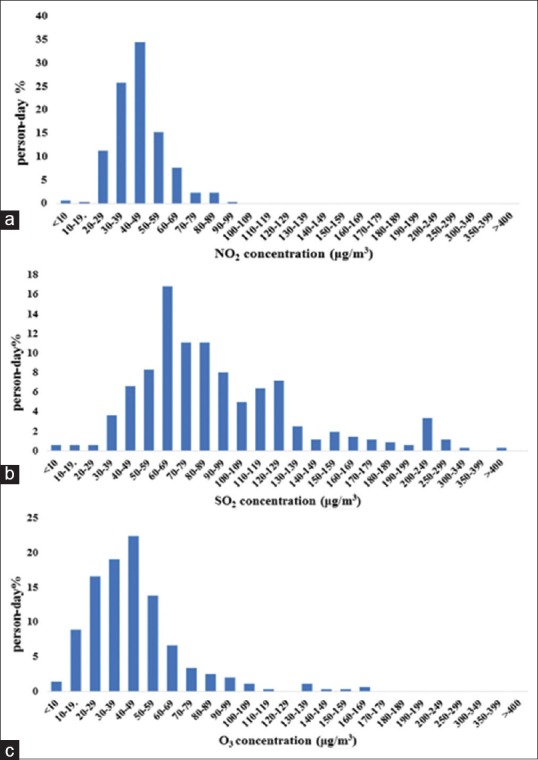
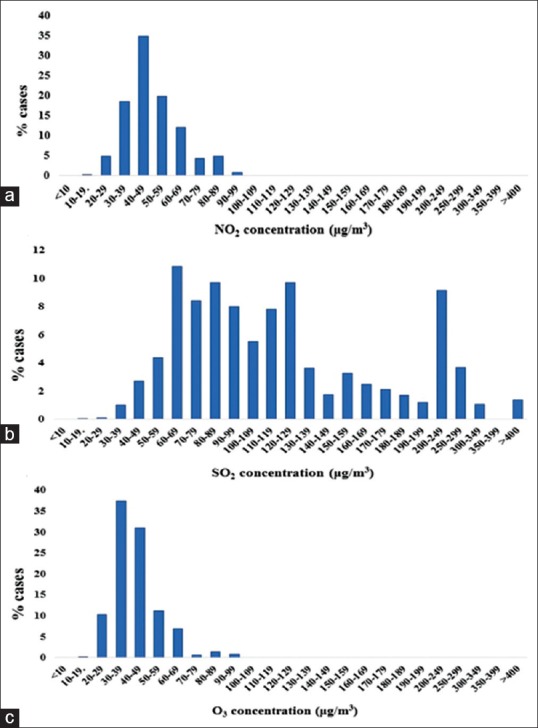
Figure 2 indicates the percentage of days that people was exposed to different concentrations of NO2 (a), SO2 (b), and O3 (c). The highest percentage of exposure days to the highest concentration of NO2, SO2, and O3 were 34.46%, 16.85%, and 42.74% of a year, respectively. These correspondence concentration ranges for NO2, SO2, and O3 were 40–49, 60–69, and 30–39 μg/m3, respectively. For these concentrations, the highest percentage of deaths associated with NO2, SO2, and O3 was 34.8%, 10.88%, and 37.52%, respectively. It means the occurrence days of this concentration ranges throughout the year were more than the other ranges [Figure 3].
Figure 2.

Percentage of days that people are exposed to different concentrations of (a) NO2, (b) SO2, and (c) O3
Figure 3.

Percentage of cases that are exposed to different concentrations of (a) NO2, (b) SO2 and (c) O3
Discussion
The annual average of NO2 concentration (44.30 μg/m3) was 1.1 times greater than the WHO guideline (40 μg/m3) and its annual maximum concentration (120.5 μg/m3) was 3.01 times greater than the WHO guideline.[12] The annual average and annual maximum of SO2 levels were 93.2 and 590.9 μg/m3, respectively, these value is also higher than the WHO guideline (20 μg/m3).[12] The annual average and annual maximum concentration of 1-h O3 were 38.5 and 93.26 μg/m3, respectively, which is lower than the WHO guideline (100 μg/m3). According to Table 1, the average concentrations of NO2 and SO2 in the winter were higher than those in the summer. Whereas, the average concentration of O3 in summer (40.08 μg/m3) was more than that in winter (36.97 μg/m3).
The average concentration of NO2, SO2, and O3 in all the monitoring stations were 44.3, 93.2, and 38.5 μg/m3, respectively [Table 1]. This is attributed to the high vehicular traffic and large industries such as power plants and iron ore industries located around the city. The maximum concentrations of NO2, SO2, and O3 in the winter were 120.5, 280.1, and 93.26 μg/m3, respectively which were higher than those in the summer. This is due to the occurrence of thermal inversion in the morning of cold days in winter. The city center and high traffic streets were more polluted leading to high levels of exposure and increased risk of respiratory diseases and premature death. Particularly, sensitive groups such as respiratory and cardiovascular patients and older people have the highest health risks among the population.[19]
The results of a study in Mongolia in 2013, showed that the average concentration of NO2 and SO2 in the winter was more than the summer, and the concentration of these pollutants was significantly reduced in areas outer the city centers and far from the industries and power plants.[20]
In the present study, short-term health effects of NO2 and SO2 are presented as total number of deaths, cardiovascular and respiratory diseases, hospitalization due to COPD and acute myocardial infarction; and short-term health effects of O3 is presented as total number of deaths, cardiovascular and respiratory diseases. The results showed that the number of deaths per year related to NO2, SO2, and O3 (BI 598.3) were 109, 365, and 136 cases, respectively. According to a similar study conducted in Tehran, the number of deaths attributable to NO2, SO2, and O3 (total population = 8,700,000 persons) was 1050, 1458, and 819 cases, respectively.[2] The number of deaths in Mashhad (total population = 2,766,000 persons) was 290, 130, and 274 cases, respectively in 2015.[8] The difference between the cases of total mortality in Tehran and Mashhad cities with Isfahan could be due to higher population, traffic and concentration of the pollutants in Tehran and Mashhad than Isfahan.
Another study conducted in Shiraz indicated that there was a meaningful relationship between the number of hospital admissions due to cardiovascular, respiratory and heart diseases and ambient NO2 and SO2 concentrations.[17]
In Isfahan (total population = 1,760,940 persons), the number of deaths due to cardiovascular and respiratory diseases and hospitalization with COPD diseases, and acute myocardial infarction caused by NO2 was 30, 0, 64, and 120 cases, and that attributable to SO2 was 277, 51, 868, and 29 cases, respectively. The number of cardiovascular and respiratory diseases attributable to O3 was 49 and 15 cases, respectively. Zallaghi et al. have reported that the number of acute myocardial infarction and deaths with COPD and cardiovascular diseases by NO2 in Tabriz (population = 1,545,000 persons) was 16, 33, and 13 cases, respectively.[6] Ghozikali et al. have found that the number of deaths (COPD) caused by NO2 and SO2 in Tabriz was 13 and 6 cases, respectively.[21]
Each of Isfahan's residents among the year 34.46% of the days was exposed to 40–49 μg/m3 of NO2, 16.85% of the days to 50–59 μg/m3 of SO2 and 42.74% of the days to 30–39 μg/m3 of O3. That means, the residents in 127 days of the year were exposed to the highest concentration of NO2 and 60 days of the year to the highest concentration of SO2. Considering a total nonaccidental mortality of 10,537 cases per year, in our study, 4350 mortality cases due to cardiovascular diseases and 703 mortality cases due to respiratory diseases were estimated.
We can conclude that for NO2, SO2, and O3 about 1.03% (109 cases), 3.46% (365 cases), and 1.29% (136 cases) of the total mortality is attributed to these pollutants, respectively. Furthermore, 0.28% (30 cases), 2.62% (277 cases), and 0.46% (49 cases) of deaths caused by cardiovascular diseases, and 0% (0 cases), 0.48% (51 cases), and 0.14% (15 cases) of deaths due to respiratory diseases are related to these pollutants, respectively. In a study conducted in South Korea, in Suwon city with a population of 1,180,000 residents, the attributable mortality and the (AP) for NO2, SO2, and O3 were 1.9% (81 cases), 0.3% (11 cases), and 1% (43 cases), respectively.[22] In another study in Italy, the value of AP for total mortality ascribable to NO2 and O3 was 1.8% and 1.5%, respectively.[3]
As shown in Table 3, the number of mortality cases caused by COPD diseases attributable to NO2 and SO2 exposure was respectively 623 and 103 cases. The acute myocardial infarction attributable to NO2 and SO2 was 29 and 120 cases, respectively. In a study in Mashhad city, Iran, the mortality cases caused by acute myocardial infarction attributable to NO2 and SO2 exposure was 62 (1.13%) and 10 (0.61%) cases, respectively.[8] The lower amount of AP by COPD for SO2 compared to NO2 indicates a higher COPD-RR caused by NO2.
In our study, increasing every 10 μg/m3 in the NO2, SO2, and O3 concentrations caused an increase in the risk of death by 0.36%, 0.79%, and 0.83%, respectively. In Mashhad city, with every 10 μg/m3 increase in the concentrations of NO2, SO2, and O3, RRs of 0.4%, 0.46%, and 0.6%, have been reported, respectively.[8] The RR value ascribable to NO2 in our study was approximately similar to that in Mashhad.
A weakness of the AirQ model is that it is not taken into consideration the health effects caused by exposure to mixtures of several pollutants or their synergistic effects, but only the effect of pollutants is investigated individually. However, in the quantitative assessment of health impacts of air pollution, the interaction between different pollutants cannot be investigated. Because it requires knowledge about the mechanism of the toxicity of different compounds which is rarely available. Usually, it is often assumed that simultaneous effect of several pollutants is additive compared to the effect of each pollutant. However, taking into account a single effect for an air pollutant is not true because most of the time they have a significant and positive correlation with each other. Hence, the health effects caused by a pollutant can be increased.[8]
Conclusions
In the present study, the residents of Isfahan were exposed to NO2 and SO2 concentrations higher than the WHO recommended guideline on all days of the year. The results showed considerable mortality attributed to these pollutants in Isfahan. This software, in spite of some limitations, can provide useful information regarding health outcome of the pollutants for the health authorities. They can use this information in the strategy planning to reduce the emission and to control the health effects of the pollutants in the city. Thus, to reduce health impacts of the pollutants, the fulfillment of a suitable emission reduction program is very necessary.
Financial support and sponsorship
Nil.
Conflicts of interest
There are no conflicts of interest.
Acknowledgments
The collaboration of the Isfahan Department of Environment and Health Center of Isfahan province in providing required information is greatly acknowledged.
References
- 1.Gholampour A, Nabizadeh R, Naseri S, Yunesian M, Taghipour H, Rastkari N, et al. Exposure and health impacts of outdoor particulate matter in two urban and industrialized area of Tabriz, Iran. J Environ Health Sci Eng. 2014;12:27. doi: 10.1186/2052-336X-12-27. [DOI] [PMC free article] [PubMed] [Google Scholar]
- 2.Naddafi K, Hassanvand MS, Yunesian M, Momeniha F, Nabizadeh R, Faridi S, et al. Health impact assessment of air pollution in megacity of Tehran, Iran. Iranian J Environ Health Sci Eng. 2012;9:28. doi: 10.1186/1735-2746-9-28. [DOI] [PMC free article] [PubMed] [Google Scholar]
- 3.Fattore E, Paiano V, Borgini A, Tittarelli A, Bertoldi M, Crosignani P, et al. Human health risk in relation to air quality in two municipalities in an industrialized area of Northern Italy. Environ Res. 2011;111:1321–7. doi: 10.1016/j.envres.2011.06.012. [DOI] [PubMed] [Google Scholar]
- 4.Mokhtari M, Hajizadeh Y, Mohammadi A, Miri M, Abdollahnejad A, Niknazar H. Ambient variations of benzene and toluene in Yazd, Iran, using geographic information system. J Mazandaran Univ Med Sci. 2016;26:131–9. [Google Scholar]
- 5.Mokhtari M, Miri M, Mohammadi A, Khorsandi H, Hajizadeh Y, Abdolahnejad A. Assessment of air quality index and health impact of PM10, PM2.5 and SO2 in Yazd, Iran. J Mazandaran Univ Med Sci. 2015;25:132. [Google Scholar]
- 6.Zallaghi E, Geravandi S, Haddad MN, Goudarzi G, Valipour L, Salmanzadeh S, et al. Estimation of health effects attributed to nitrogen dioxide exposure using the airq model in Tabriz City, Iran. Health Scope. 2015;4:31–7. [Google Scholar]
- 7.Goudarzi G, Geravandi S, Foruozandeh H, Babaei AA, Alavi N, Niri MV, et al. Cardiovascular and respiratory mortality attributed to ground-level ozone in Ahvaz, Iran. Environ Monit Assess. 2015;187:487. doi: 10.1007/s10661-015-4674-4. [DOI] [PubMed] [Google Scholar]
- 8.Miri M, Derakhshan Z, Allahabadi A, Ahmadi E, Oliveri Conti G, Ferrante M, et al. Mortality and morbidity due to exposure to outdoor air pollution in Mashhad metropolis, Iran. The AirQ model approach. Environ Res. 2016;151:451–7. doi: 10.1016/j.envres.2016.07.039. [DOI] [PubMed] [Google Scholar]
- 9.Pope CA. Epidemiology of fine particulate air pollution and human health: Biologic mechanisms and who's at risk? Environ Health Perspect. (3rd) 2000;108(Suppl 4):713–23. doi: 10.1289/ehp.108-1637679. [DOI] [PMC free article] [PubMed] [Google Scholar]
- 10.Golub A, Strukova E. Evaluation and identification of priority air pollutants for environmental management on the basis of risk analysis in Russia. J Toxicol Environ Health A. 2008;71:86–91. doi: 10.1080/15287390701558238. [DOI] [PubMed] [Google Scholar]
- 11.Forsberg B, Hansson HC, Johansson C, Areskoug H, Persson K, Järvholm B. Comparative health impact assessment of local and regional particulate air pollutants in Scandinavia. Ambio. 2005;34:11–9. [PubMed] [Google Scholar]
- 12.Tsai SS, Goggins WB, Chiu HF, Yang CY. Evidence for an association between air pollution and daily stroke admissions in Kaohsiung, Taiwan. Stroke. 2003;34:2612–6. doi: 10.1161/01.STR.0000095564.33543.64. [DOI] [PubMed] [Google Scholar]
- 13.World Health Organization. Copenhagen, Denmark: World Health Organization; 2006. Air Quality Guidelines: Global Update 2005: Particulate Matter, Ozone, Nitrogen Dioxide, and Sulfur Dioxide. [Google Scholar]
- 14.Jafari N, Abdolahnejad A, Ebrahimi A, Bina B, Mortezaie S. Geographic information system based noise study in crowded areas of Isfahan city in 2010-2011. Int J Environ Health Eng. 2015;4:24. [Google Scholar]
- 15.Modarres R, Dehkordi AK. Daily air pollution time series analysis of Isfahan City. Int J Environ Sci Technol. 2005;2:259–67. [Google Scholar]
- 16.Statistical Yearbook of the Province's Population. Isfahan: The Registrar-General of Isfahan Province. 2013. [Last accessed on 2016 Apr 20]. Available from: http://www.eocr.ir .
- 17.Gharehchahi E, Mahvi AH, Amini H, Nabizadeh R, Akhlaghi AA, Shamsipour M, et al. Health impact assessment of air pollution in Shiraz, Iran: A two-part study. J Environ Health Sci Eng. 2013;11:11. doi: 10.1186/2052-336X-11-11. [DOI] [PMC free article] [PubMed] [Google Scholar]
- 18.Künzli N, Kaiser R, Medina S, Studnicka M, Chanel O, Filliger P, et al. Public-health impact of outdoor and traffic-related air pollution: A European assessment. Lancet. 2000;356:795–801. doi: 10.1016/S0140-6736(00)02653-2. [DOI] [PubMed] [Google Scholar]
- 19.Orru H, Teinemaa E, Lai T, Tamm T, Kaasik M, Kimmel V, et al. Health impact assessment of particulate pollution in Tallinn using fine spatial resolution and modeling techniques. Environ Health. 2009;8:7. doi: 10.1186/1476-069X-8-7. [DOI] [PMC free article] [PubMed] [Google Scholar]
- 20.Huang YK, Luvsan ME, Gombojav E, Ochir C, Bulgan J, Chan CC. Land use patterns and SO2 and NO2 pollution in Ulaanbaatar, Mongolia. Environ Res. 2013;124:1–6. doi: 10.1016/j.envres.2013.02.006. [DOI] [PubMed] [Google Scholar]
- 21.Ghozikali MG, Mosaferi M, Safari GH, Jaafari J. Effect of exposure to O3, NO2, and SO2 on chronic obstructive pulmonary disease hospitalizations in Tabriz, Iran. Environ Sci Pollut Res Int. 2015;22:2817–23. doi: 10.1007/s11356-014-3512-5. [DOI] [PubMed] [Google Scholar]
- 22.Jeong SJ. The impact of air pollution on human health in Suwon City. AJAE. 2013;7:227–33. [Google Scholar]


