
Figure 2.
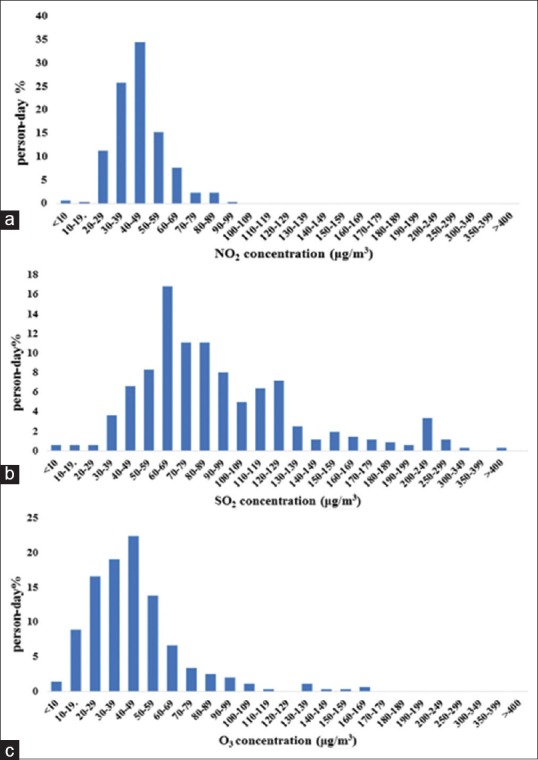
Percentage of days that people are exposed to different concentrations of (a) NO2, (b) SO2, and (c) O3
Official websites use .gov
A
.gov website belongs to an official
government organization in the United States.
Secure .gov websites use HTTPS
A lock (
) or https:// means you've safely
connected to the .gov website. Share sensitive
information only on official, secure websites.
Percentage of days that people are exposed to different concentrations of (a) NO2, (b) SO2, and (c) O3