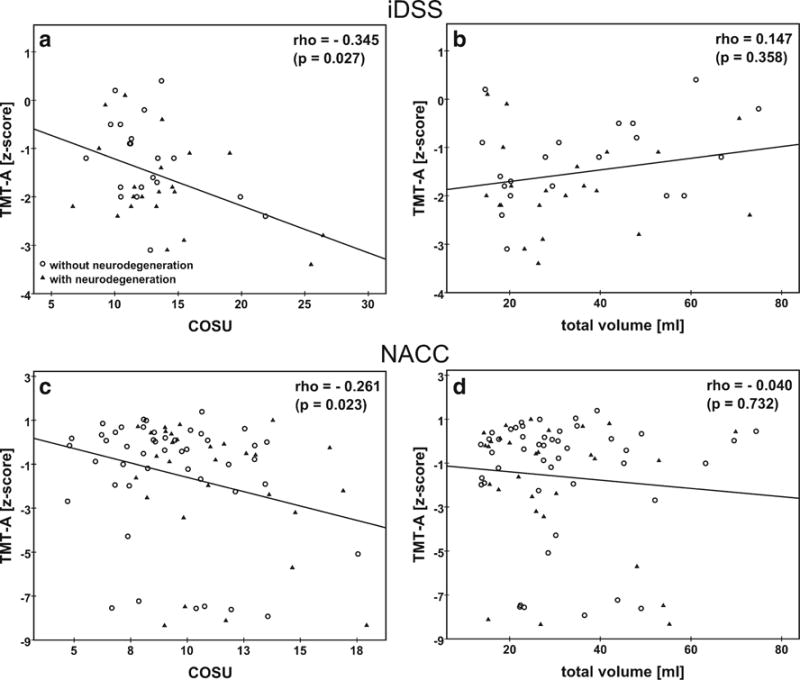
Fig. 2.

Association between the performance in the trail making test A (z-score) and the WMH confluency sum score (COSU) or the total WMH volume (ml) in the iDSS and in the NACC sample. Different symbols are used for subjects with neurodegenerative disease (iDSS sample: AD, MD and ‘neurodegenerative diseases other than AD’, NACC sample: AD) and subjects without neurodegenerative disease (iDSS sample: CVD and ‘other non-neurodegenerative diseases’, NACC sample: VaD and NC). The Spearman correlation coefficient rho and its p-value is displayed in each panel. The line represents the result of linear regression. The NACC sample includes 9 subjects who completed the TMT-A test in more than 150 s which, however, is the time limit for this test (Weintraub et al. 2009). For the computation of z-scores, the completion time was set to 150 s in these subjects. Repeat Spearman analysis in the NACC sample without these 9 subjects resulted in rho = −0.239 (p = 0.052) and rho = 0.049 (p = 0.691) for the correlation between TMT-A performance and the COSU or total volume, respectively.
