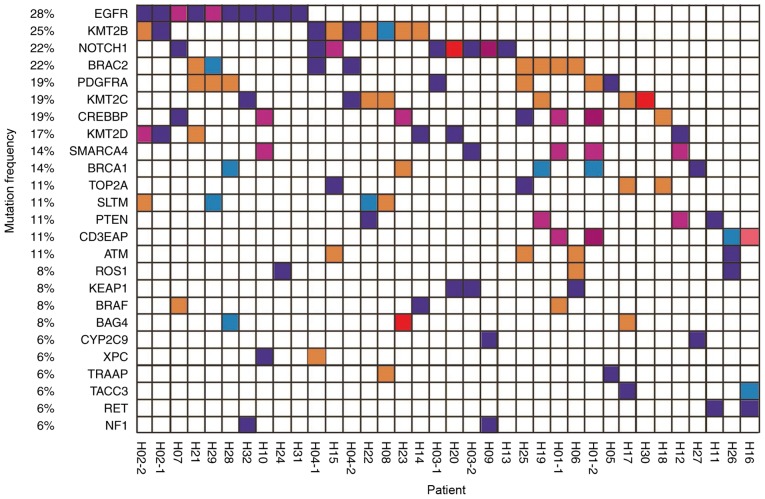
Figure 1.
Mutation spectrum of 36 plasma samples from 32 patients with non-small cell lung cancer. The genes with a high mutation frequency among all patients are listed on the left and individual patients are represented by the columns. First and second blood draws are indicated by −1 and −2, respectively. Mutation types of nonsynonymous single nucleotide variant, stop-gain, frameshift insertion, non-frameshift deletion, and non-frameshift insertion are represented by purple, blue, dark red, red, orange and pink respectively.

