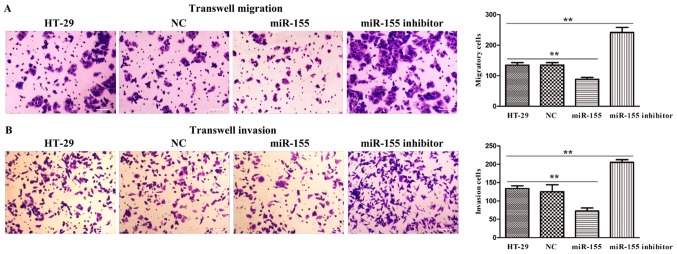
Figure 5.
miR-155 suppressed the (A) migration and (B) invasion of HT-29 cells. Left part displayed representative images (×400) of each group in the Transwell assays, whereas right panel exhibited the statistics of the migration and invasion. Data shown are means ± SD (n=3). Scale bars=100 µm. **P<0.01.

