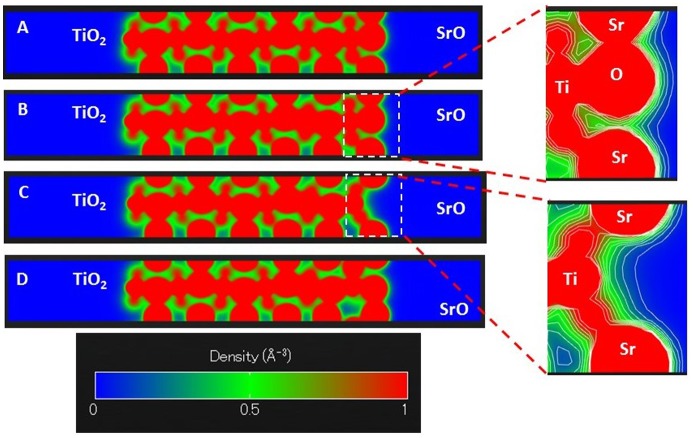
Figure 5.
Slice-planes through the electron density along the c axis of the slabs for (A) SrTiO3 slab; (B) iron-doped SrTiO3 slab without oxygen vacancies; (C) iron-doped SrTiO3 slab with oxygen vacancy in the surface layer; (D) iron-doped SrTiO3 slab with oxygen vacancy in the subsurface layer. Electron density is given in e−/Å3. Electron density between 0 and 1 e−/Å3 is plotted in the blue–green–red color scheme. Contour lines slow the electron density surfaces at each 0.1 e−/Å3.

