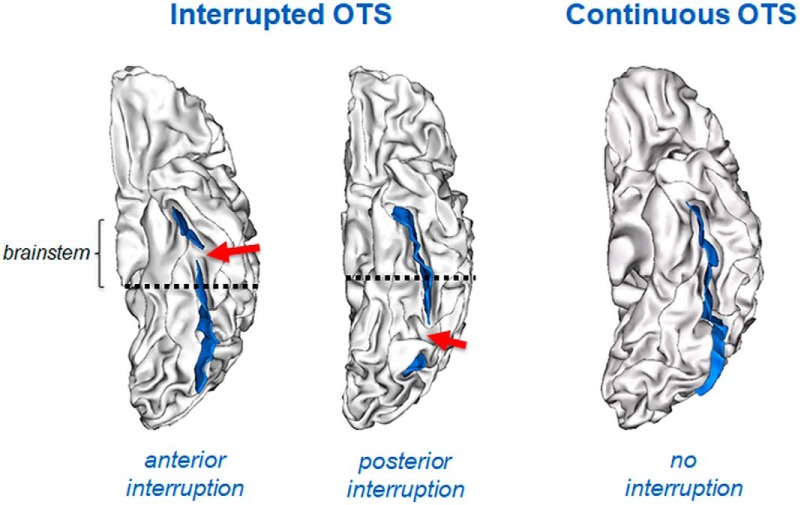
Figure 2.
Sulcal patterns of the lateral OTC. Left hemisphere with an anterior interruption (left panel), a posterior interruption (middle panel), or a continuous sulcus. Sulcus are depicted in blue and the sulcal interruption with a red arrow. The PEB (dashed line) was used as a limit to define the anterior and posterior interruptions.

