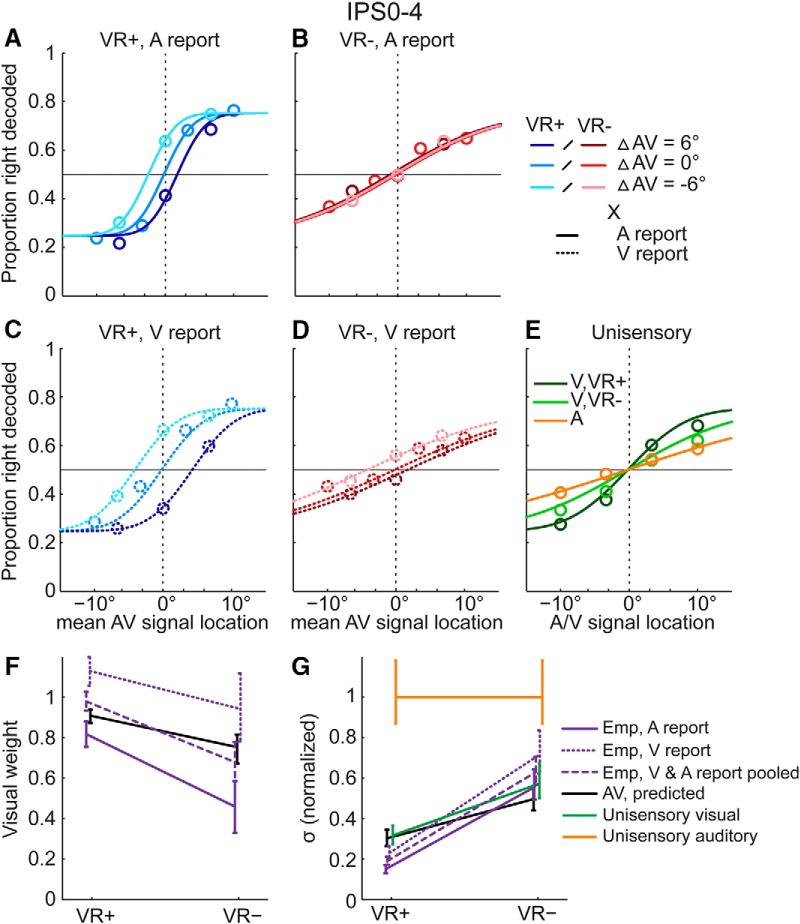
Figure 3.
fMRI results in the intraparietal sulcus: neurometric functions, visual weights and audiovisual variances. In intraparietal sulcus (IPS0–4), neurometric functions were fitted to the fraction of decoded “right” location responses plotted as a function of the mean audiovisual (AV) location (see figure 2 legend for additional information). A–D, Neurometric functions are plotted separately for the four conditions in our 2 (visual reliability: high, VR+ vs. low, VR-) x 2 (modality-specific report: auditory versus visual) factorial design. E, In unisensory conditions, psychometric functions were fitted to the fraction of “right” location responses plotted as a function of the signal location from unisensory auditory (A) and visual conditions of high (V, VR+) and low (V, VR-) visual reliability. F, Visual weights (mean and 68% bootstrapped confidence interval): MLE-predicted and empirical visual weights for 2 (visual reliability: high, VR+ vs. low, VR-) x 2 (modality-specific report: auditory versus visual) AV conditions. To facilitate the comparison with the MLE predictions that do not depend on modality-specific report, the visual weights are also plotted after pooling the data across both report conditions and re-fitting the neurometric functions. G, Standard deviations (σ, mean and 68% bootstrapped confidence interval): Unisensory and audiovisual MLE predicted and empirical standard deviations for the same combination of conditions as in F. For illustrational purposes, standard deviations were normalized by the auditory standard deviation (original auditory standard deviation = 21.54). For extended analyses controlling motor responses and global interhemispheric activation differences in IPS0–4, see Fig. 3-1 and 3-2.

