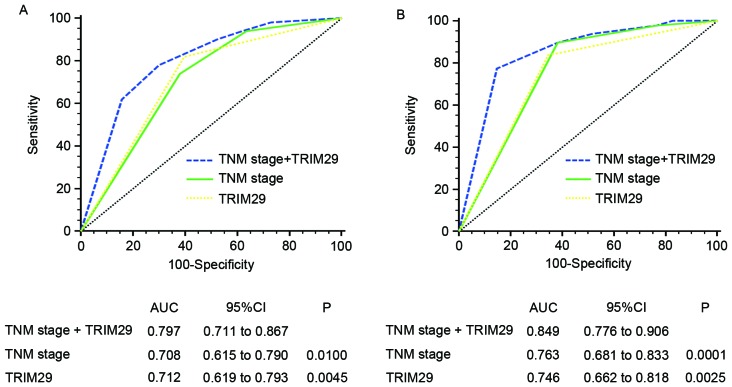
Figure 3.
ROC analysis for predicting overall survival in patients with gastric cancer. ROC analysis of the prognostic sensitivity and specificity for overall survival of the TNM stage/TRIM29 expression, TNM stage, and TRIM29 expression models in (A) the training (n=113) and (B) validation sets (n=130). ROC, receiver operating characteristic; TNM, tumor-node-metastasis; TRIM29, tripartite motif containing 29; AUC, area under the curve; CI, confidence interval; n, number of patients.

