Figure 1.

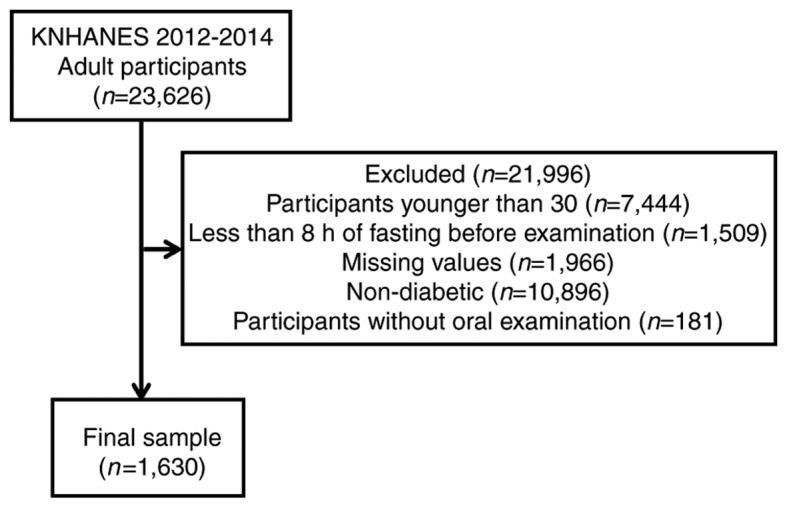
Flow chart of participants included and excluded from the study. KNHANES, Korean National Health and Nutrition Examination Survey.

Flow chart of participants included and excluded from the study. KNHANES, Korean National Health and Nutrition Examination Survey.