
Fig. 4.
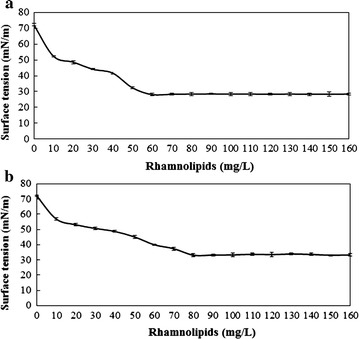
Relationship graphs between the surface tension and concentration of rhamnolipids products: a rhamnolipids produced at aerobic conditions, b rhamnolipids produced at anaerobic conditions
Official websites use .gov
A
.gov website belongs to an official
government organization in the United States.
Secure .gov websites use HTTPS
A lock (
) or https:// means you've safely
connected to the .gov website. Share sensitive
information only on official, secure websites.
Relationship graphs between the surface tension and concentration of rhamnolipids products: a rhamnolipids produced at aerobic conditions, b rhamnolipids produced at anaerobic conditions