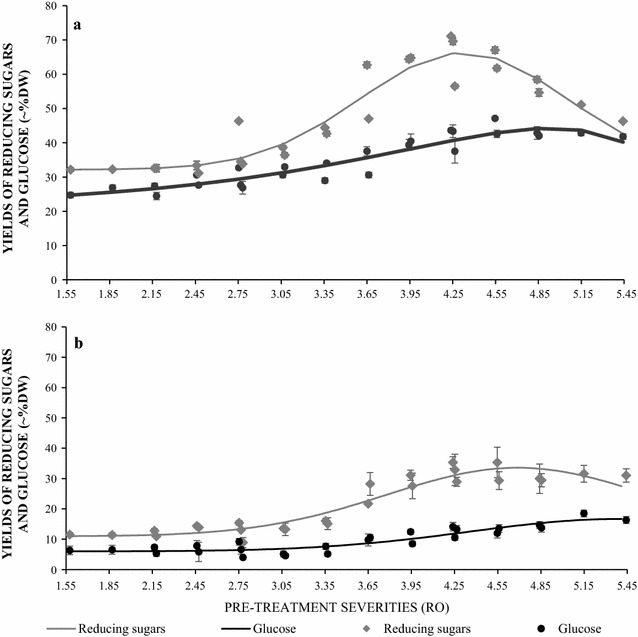
Fig. 1.

Saccharification of pre-treated rice straw and husk. Yields of both glucose and reducing sugars from rice straw (a) and rice husk (b) pre-treated at different severities, after a 96 h saccharification using cellulase (CTec-2) at 50 °C. The light grey curve represents the proportion of total reducing sugars in air-dried material and dark grey curve represents the proportion of glucose in air-dried material. N = 2; data were processed by using Genstart (Edition 18) to show the trend
