
Fig. 4.
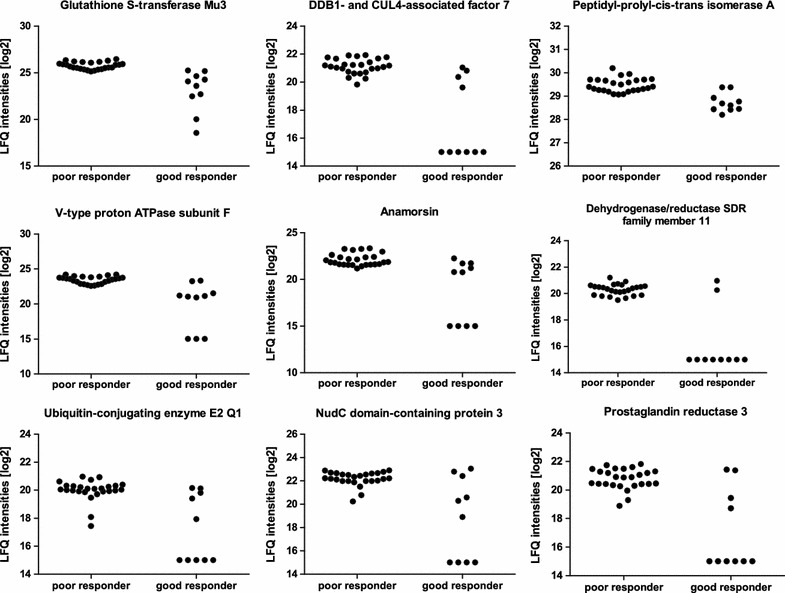
Protein panel displays differences between poor and good responders. For each of the 9 most class-discriminating proteins (listed in Table 3), label-free quantification (LFQ) intensities in a logarithmic scale to the basis 2 are indicated. LFQ intensities for proteins not detected in a replicate were replaced by 15