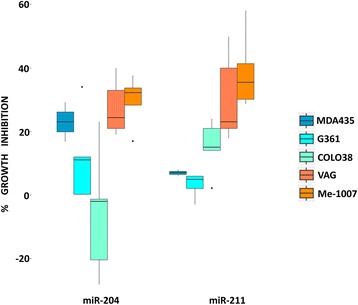
Fig. 3.

Exogenous miR-204 and miR-211 and cell growth in melanoma cell lines. The box-plots represent the relative cell growth inhibition upon transfection of miR-204 and miR-211 in five melanoma cell lines. MTS assays were baseline subtracted from control and normalized, as described in the supplementary methods (Additional file 15). The blue shaded cell lines were BRAF mutated and the orange were BRAF wild type. No cell line among those treated harbored an NRAS mutation
