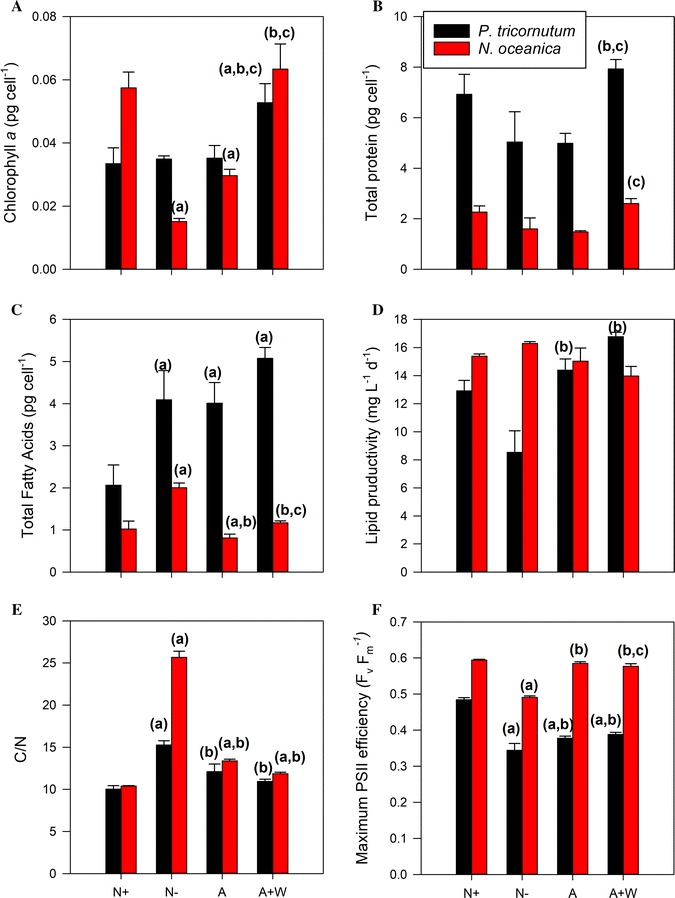
Fig. 3.

Biochemical composition and maximum photosynthetic PSII efficiency estimated at the end of the experiment (day 3). Phaeodactylum tricornutum (black bars) and N. oceanica (red bars) comparisons for A cell-specific chlorophyll a concentration (pg cell−1), B cell-specific total protein concentration (pg cell−1), C cell-specific total fatty acids (pg cell−1), D lipid productivity (mg L−1 day−1), E Carbon to nitrogen ratio and F maximum photosynthetic PSII efficiency (Fv/Fm) for the two species in the four conditions [nitrate (N+), nitrogen free (N−), ammonium (A) and ammonium with tungstate (A+W) conditions]. Mean (± standard error) values are given. Analysis of the variance followed by Bonferroni post hoc test (p value < 0.05) was carried out to estimate the significance of the differences between treatments, being (a) significant difference when compared with the N+ treatment, (b) significant difference when compared with the N− treatment and (c) significant difference when compared with the A treatment
