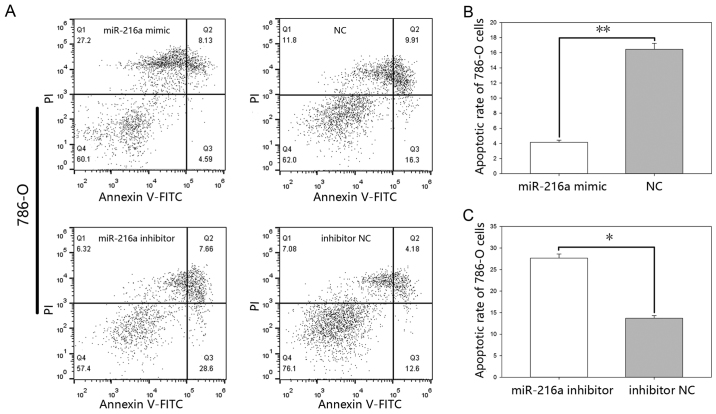
Figure 8.
(A) Flow cytometry results of apoptosis in 786-O cells. Q3 was used to calculate the apoptotic rates. Cell apoptosis rate (%) of cells following transfection with (B) miR-216a-5p mimic or NC and (C) miR-216a-5p inhibitor or inhibitor NC. *P<0.05, **P<0.01. miR, microRNA; FITC, fluorescein isothiocyanate; NC, negative control.

