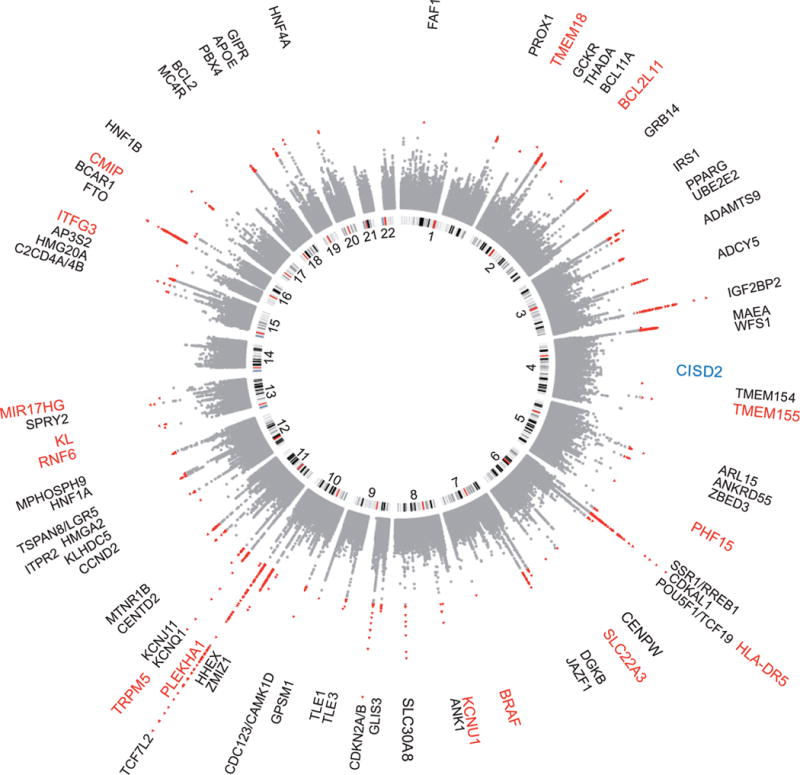
Figure 1.

A circular Manhattan plot summarizing the association results for the T2D scan. Black: Previously established T2D loci, Red: Previously unreported T2D loci from trans-ethnic meta-analysis, Blue: Previously unreported T2D loci from EUR only meta-analysis.
