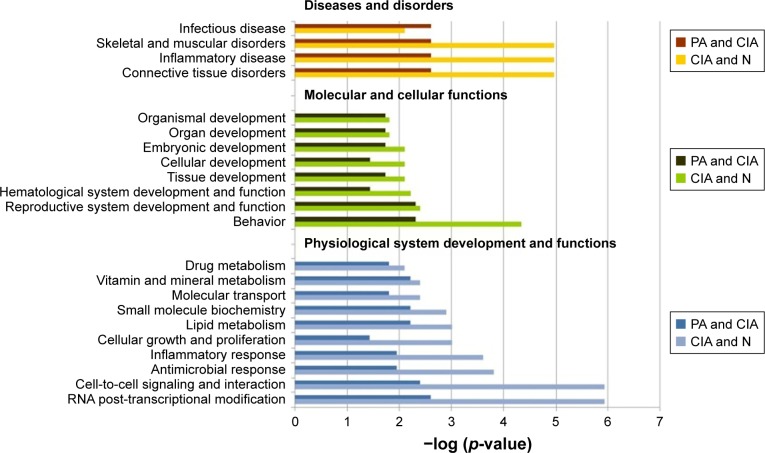
Figure 3.
The top bio-functions of collagen-induced arthritis (CIA) day 42 versus normal (N) control day 42 versus paeoniflorin (PA) day 42 by ingenuity pathway analysis (IPA). Orange: the top function from the diseases and disorders category; green: the top function from physiological system development and functions category; blue: the top function from the molecular and cellular functions category.

