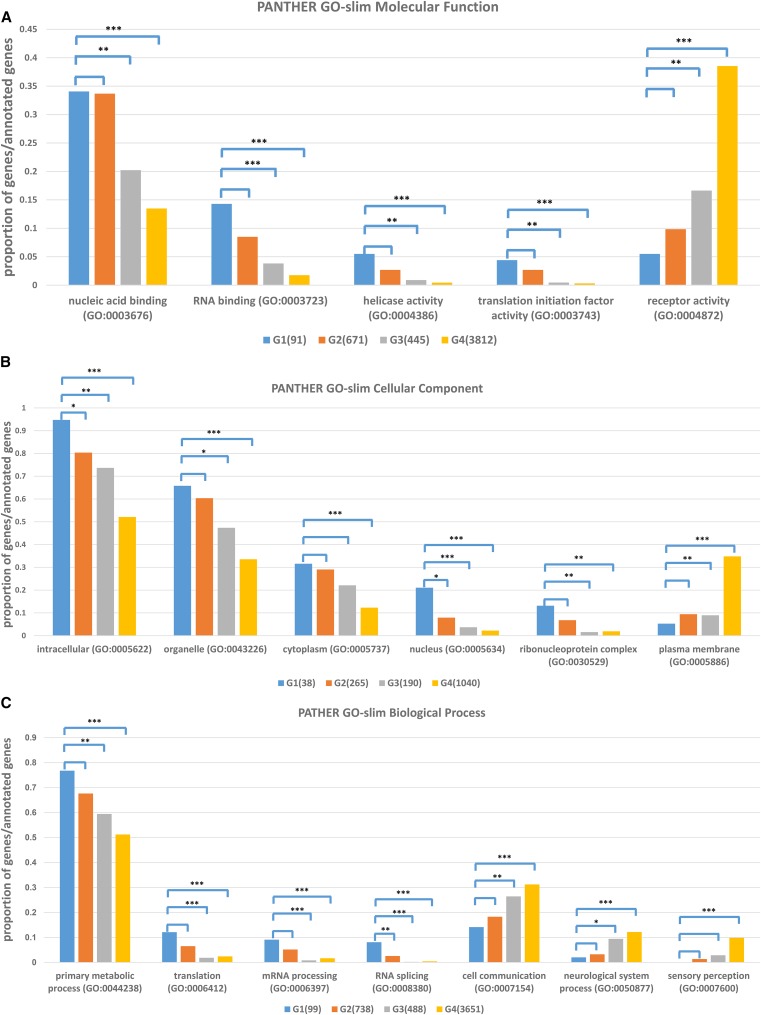
Figure 4.
Genes from each group annotated with three ontology terms: (A) molecular function, (B) cellular component, and (C) biological process. The x-axis lists several GO terms in each GO category and the y-axis is the proportion of genes for each GO term over the total number of annotated genes in each group. Four groups are shown in separate colors: G1 in blue, G2 in orange, G3 in gray, and G4 in gold. Statistical difference was calculated for G1 vs. G2, G3, and G4 individually by using Fisher’s exact test (* P-value < 0.05, ** P-value < 0.01, *** P-value < 0.001).

