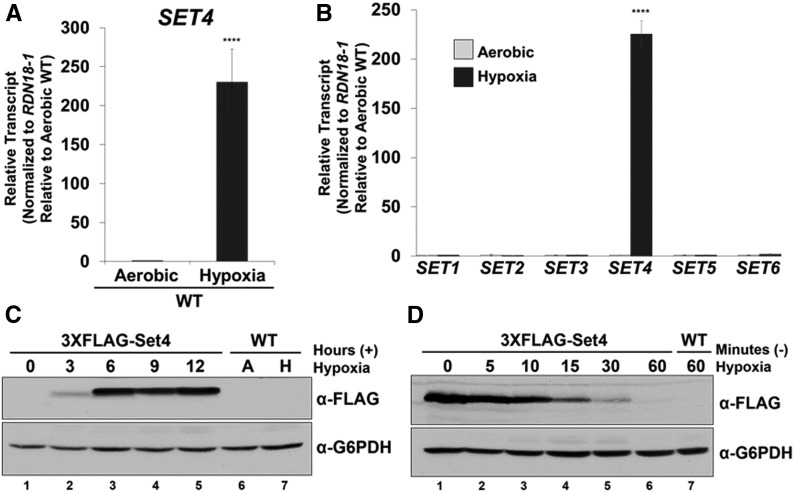
Figure 3.
Hypoxia induces Set4 expression. (A and B) SET4 transcript level was determined in WT cells grown under aerobic conditions or 8 hr of hypoxia by qRT-PCR analysis. **** P < 0.0001. (B) Expression of SET1–SET6 was determined in WT cells grown under aerobic conditions or 8 hr of hypoxia by qRT-PCR analysis. Gene expression analyses were set relative to the aerobic WT using the 18S rRNA (RDN18-1) as the internal control to normalize transcript levels. Data were analyzed from three biological replicates with three technical replicates. Error bars represent SD. SET4 was the only gene that significantly changed in expression (**** P < 0.0001). (C) Western blot analysis of Set4 protein induction over time under hypoxia. Aerobic (A) and hypoxia (H). The untagged WT was used as a negative control. (D) Western blot analysis of Set4 protein levels following release from hypoxic conditions. Lane 1 represents Set4 protein levels following 8 hr of hypoxia. Lanes 2–7 indicate Set4 protein levels following release from hypoxic conditions. G6PDH was used as a loading control. Gene expression and Western blot analyses were performed in BY4741 strains.

