Figure 1.
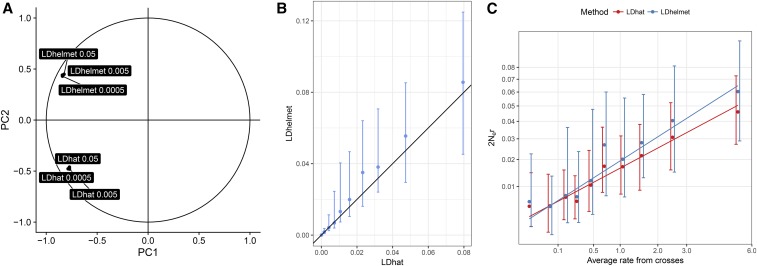
Correlations among recombination maps in Z. tritici show highly correlated estimates from two composite likelihood methods. (A) Correlation circle of the six population genomic recombination maps based on the two first factors of a principal component (PC) analysis. The programs LDhat interval (Auton and McVean 2007) and LDhelmet (Chan et al. 2012) were used with three distinct input-scaled effective population sizes (θ) of 0.0005, 0.005, and 0.05. (B) Correlation of the LDhat and LDhelmet maps with θ = 0.005. The LDhat map was discretized into 10 categories with equal numbers of points. The points and error bars represent the median and first and third quartile of the distribution for each category. (C) To assess the quality of the inferred recombination maps, genome-wide estimates of recombination were correlated with a genetic map obtained by experimental crossing of Z. tritici isolates. y-Axis: Population genomic maps were obtained by LDhat and LDhelmet with a scaled population size of 0.005. x-Axis: average recombination map from two independent crosses (Croll et al. 2015). Points and error bars represent the median and first and third quartile of the distribution for each category, obtained as in (B).

