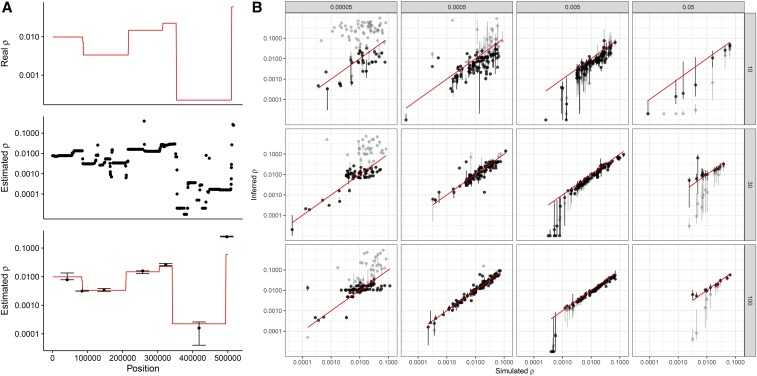
Figure 2.
Effect of sample size and diversity on the estimation of recombination rate by LDhat. Regions of 10 Mb (1 Mb for regions with θ = 0.05) were simulated using a coalescent model with variable recombination rate: random segments were generated by sampling lengths from an exponential distribution and rates from the observed distribution of recombination rates. (A) Example of a 500-kb region, with variable recombination rate (red line), LDhat estimates between pairs of SNPs (middle panel), and median (with first and third quartiles as error bars) for each segment of uniform recombination (bottom panel). (B) Inferred vs. true recombination rate for different nucleotide diversity values (θ = 2Ner) and sample sizes. Each ● corresponds to a region with constant recombination rate in the simulated alignment, as shown in (A). Bars indicate the first and third quartiles of LDhat estimates for the region. Gray points are raw estimates; black points are computed from filtered estimates (see Materials and Methods). The red diagonal line shows the 1:1 ratio. Columns indicate distinct population mutation rates and rows distinct sample sizes (number of haploid genomes).

