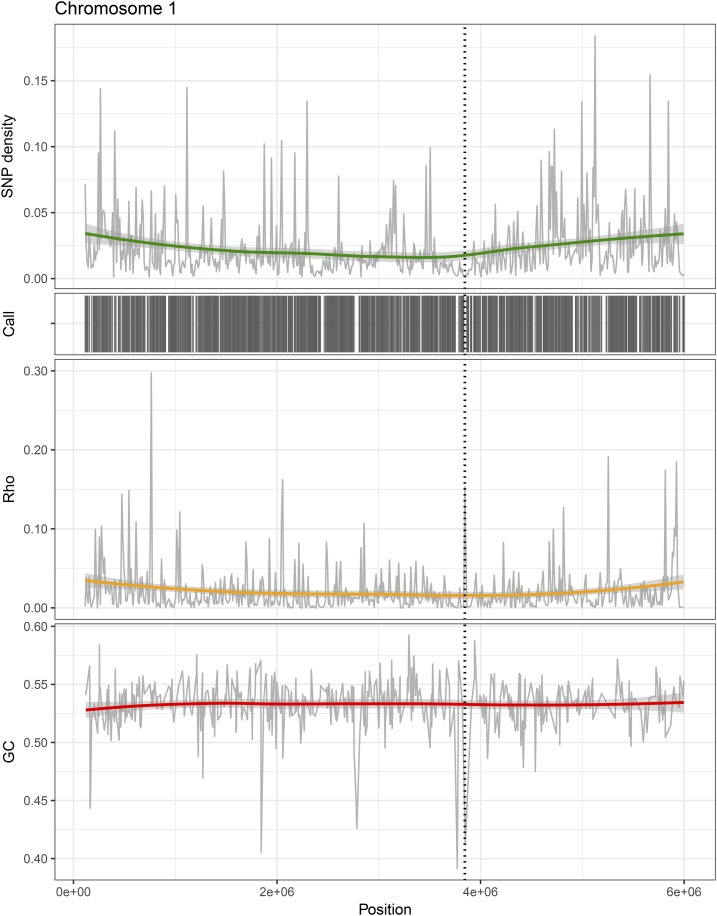
Figure 3.
Variation in recombination rate across chromosomes. Based on the population genomics data of Z. tritici and Z. ardabiliae, genome-wide patterns of recombination are estimated. Patterns of variation across chromosome 1 of Z. tritici is shown as an example. (Upper panel) SNP density in 10-kb windows with corresponding smoothing curve. (Middle panel) Distribution of called sites along the chromosome in black, corresponding to the regions that were included in the analyses. (Lower panel) Estimates of the population recombination rate ρ show a highly heterogeneous, small-scale recombination landscape across the chromosomes. (D) Observed GC content. The position of the centromere is marked over the chromosome plots as a vertical stippled line.

