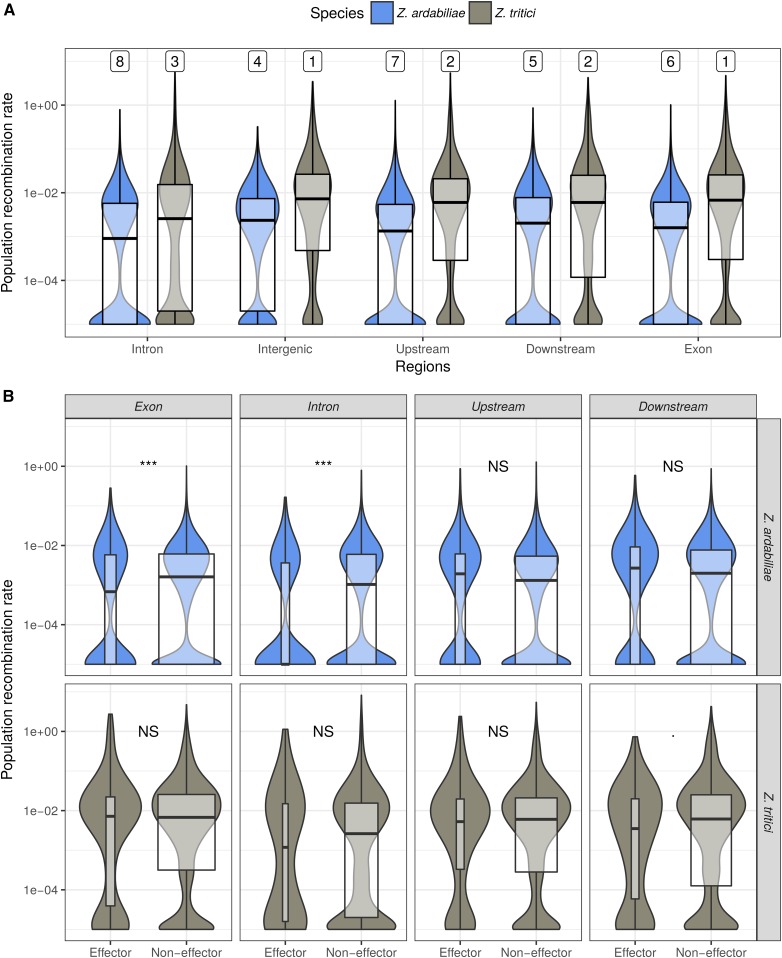
Figure 5.
Fine-scale recombination patterns within chromosomes. (A) The distribution of recombination rate estimates in different sequence features in Z. tritici and Z. ardabiliae reveals small, but significant, differences among the noncoding, coding, and UTR sequences in both species. Top line numbers indicate significance groups by decreasing value of recombination rate. Categories with identical numbers are not significantly different at the 1% level. (B) Distribution of recombination rate estimates in exons, introns, and UTRs of candidate effector and noneffector genes is shown. Bow widths are proportional to the sample sizes. For Z. ardabiliae, the recombination rate in exons and introns is significantly lower in candidate effector genes compared to noneffector genes. Wilcoxon rank test corrected for multiple testing, *** P < 0.1%. NS, nonsignificant.

