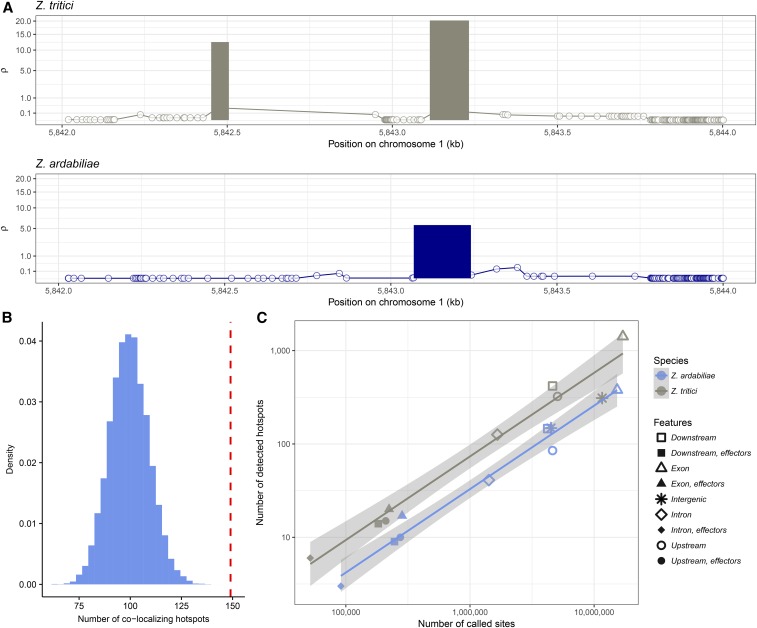
Figure 8.
Distribution of hotspots in the genomes of Z. tritici and Z. ardabiliae. (A) Example of mapped hotspot in a homologous region in Z. tritici and Z. ardabiliae. Lines indicate the background recombination rate as estimated by LDhat. Bars indicate the positions, widths, and strengths of hotspots detected by LDhot in the region, after filtering (see Materials and Methods). (B) Number of hotspots in Z. tritici in the direct 1-kb range of a hotspot in Z. ardabiliae (vertical line) and the corresponding distribution under the null hypothesis of a random distribution of hotspots. (C) Frequencies of hotspots in distinct regions of the genome. Number of detected hotspots in each region as a function of the number of called sites. Lines correspond to ordinary least-square regressions.

