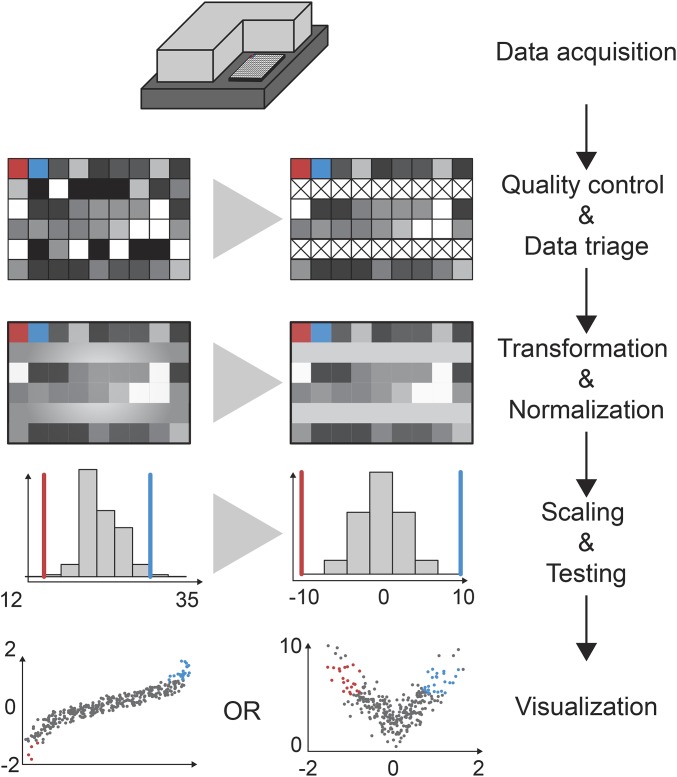
Figure 4.
Screen analysis workflow. Analyses of RNAi screens are often carried out in five distinct steps. Data acquisition is performed using luminescence or fluorescence plate readers or by automated microscopy. Each method results in single or multiple numeric values describing the observed phenotype in each well. In a second step, measurements are assessed for traceable technical artifacts for missing values and corresponding measurements can be flagged. Next, data are normalized to correct for biases caused by position of the well or the plate. This transformation can be done using methods such as B-score normalization, linear models, or median control normalization. Normalized data can be scaled to the controls and/or its own distribution such that all variables measured for each experiment (well) are comparable. Common methods include the percent of control (PoC) or z-score normalization. In a last step, data are statistically tested and visualized. Visualizations include a Q–Q plot, a waterfall plot, or the volcano plot shown here on the left and right.

