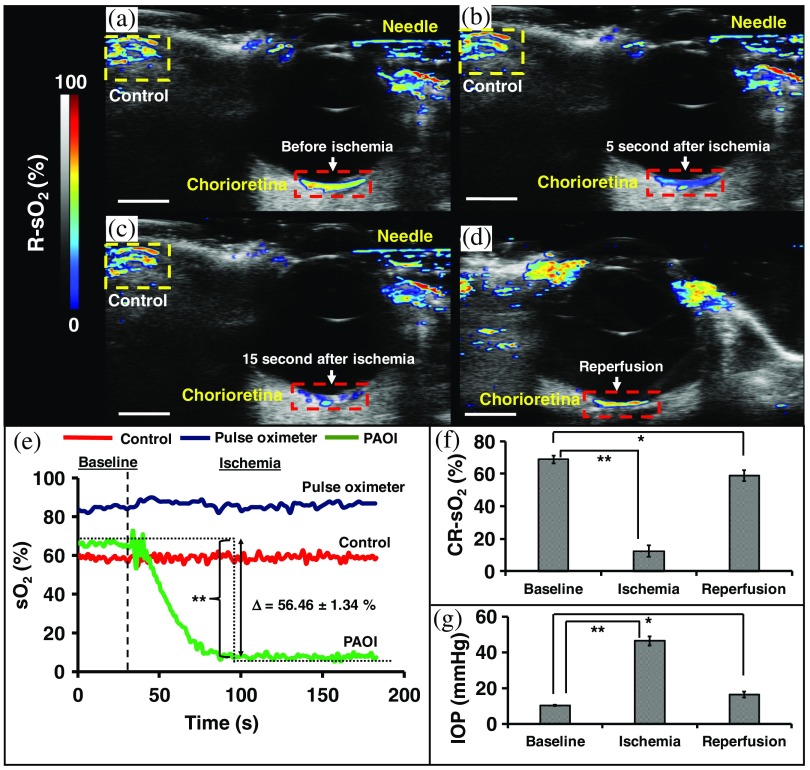
Fig. 6.
Real-time evaluation of ischemia-reperfusion model using PAOI. (a) B-mode map at baseline condition (no PBS injection-no IOP increase); a 25-gauge needle is inside the anterior segment of eye. Red and yellow dotted rectangles show the retina and control areas, respectively. The is at baseline (no IOP increase; ). (b) The map 5 s after injection of PBS in the eye. Here, the change in the retina map to blue indicates a decrease in after 5 s of IOP. (c) gradients after injection of PBS (15 s after start of injection). The IOP increased to , and the decreased to . (d) map in reperfusion condition. The imaging plane is different from other three because we had to remove the transducer and measure the IOP with a Tonopen. recovered to after the IOP returned to . (e) Real-time monitoring of and using PAOI and pulse oximetry. The shows difference between baseline and ischemia. (f) Statistical analysis of for five eyes under different conditions including baseline, ischemia, and reperfusion using PAOI. The PAOI shows sixfold decrease in during ischemia (). There was a very significant change between baseline and ischemia and a significant different in from baseline to reperfusion. (g) Statistical analysis of IOP for five eyes at baseline, ischemia, and reperfusion using Tonopen. There is negative correlation between IOP and . Error bars shows the standard deviation of five different eyes. Here, * indicates and ** indicates .

