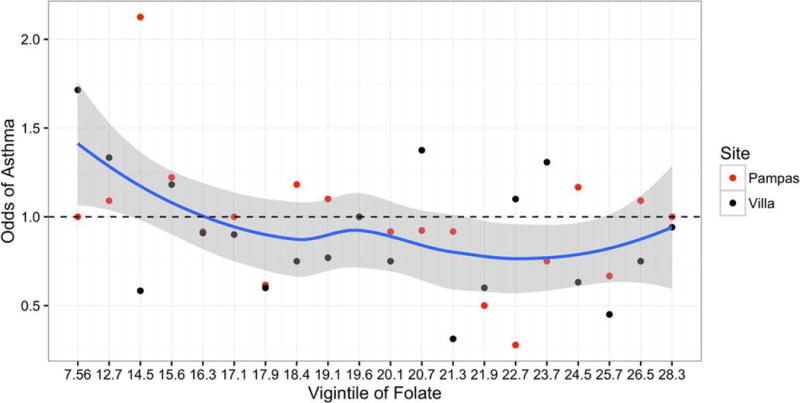
Figure 1.

Unadjusted odds of asthma across increasing vigintiles of serum folate concentrations (ng/mL). The solid blue line represents the lowess smoothed curve and the gray shaded region represent confidence intervals for this curve. The black dots indicate the odds of current asthma in Pampas de San Juan, and the red dots indicate the odds of current asthma in Villa El Salvador. The size of the dot is proportional to the number of individuals included in calculation of the odds. The numbers along the x-axis correspond to the lower thresholds of each subsequent vigintile.
