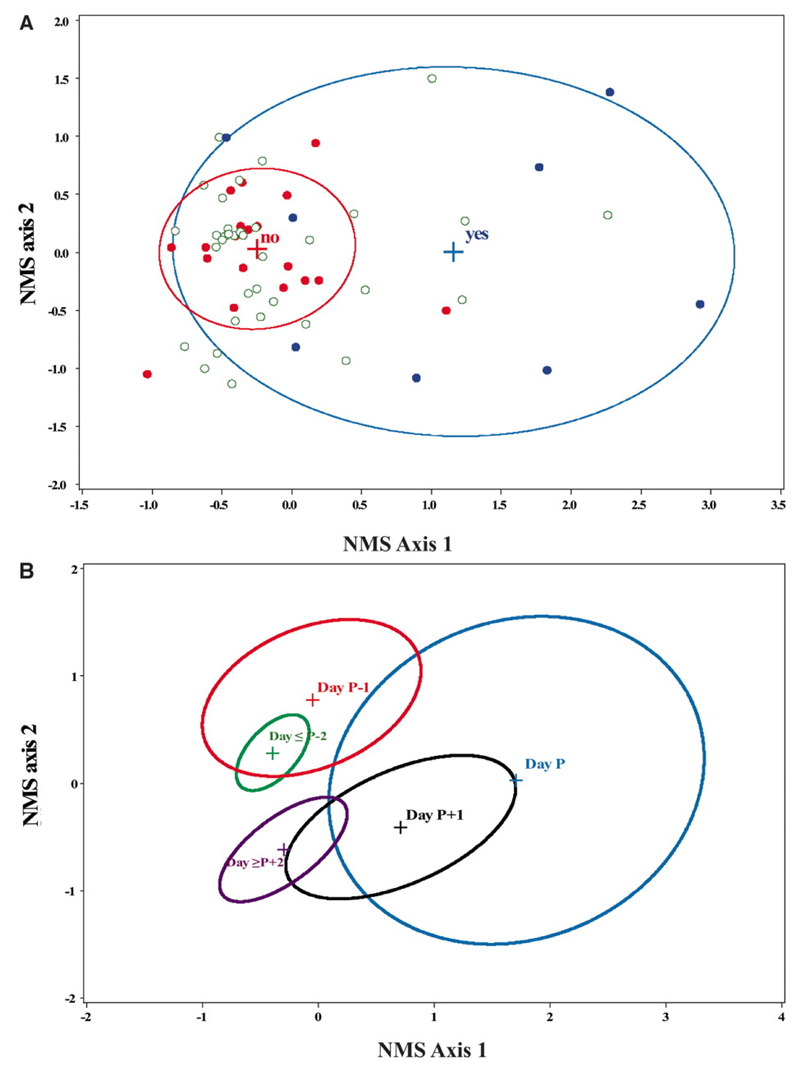
Figure 1.
Nonmetric multidimensional scaling (NMS) ordination of transmission data. The NMS final solution was two dimensional and explained 86.1% of the variation in FMD transmission success. Correlations between variables used (see Table S2) and NMS scores are shown in Fig. S1. (A) Blue circles represent days when transmission occurred, red circles when no transmission occurred and green open circles when transmission was not attempted. Ellipses indicate the mean ±1 standard deviation bivariate interval for successful and unsuccessful transmission attempts only. (B) Ellipses indicate the mean ±1 standard deviation bivariate interval for each day, where Day P is the day of peak NMS axis 1 score. Days ≥P+2 and ≤P-2 have been grouped.

