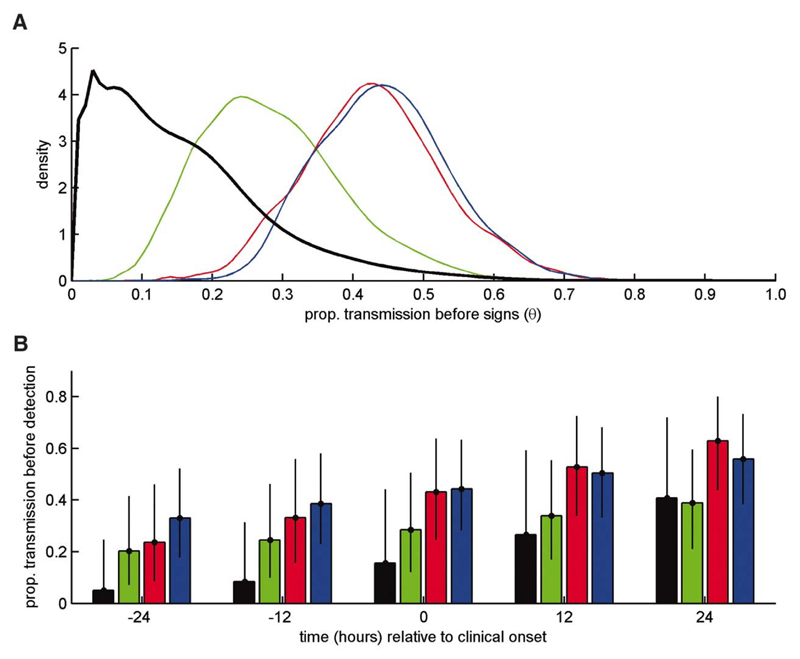
Figure 3.
Implications of results for detection and control of FMDV. (A) Marginal posterior density for the proportion of transmission that occurs before the onset of clinical signs, θ. (B) Posterior means (bars) and 95% credible intervals (error bars) for the proportion of transmission that occurs before detection assuming infected animals are detected at -24, -12, 0, +12 or +24 hrs relative to the onset of clinical signs. In each plot results are shown for the analysis based on transmission attempt outcome only (black) and virus isolation from nasal fluid (green), blood (red) or oesophageal-pharyngeal fluid (blue).

