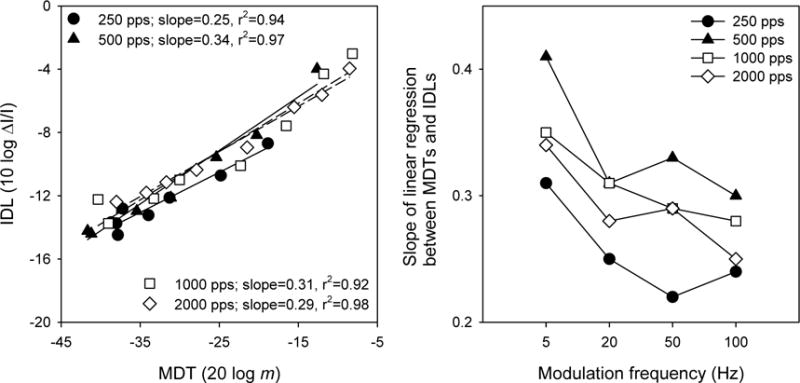
Figure 6.

Left panel: mean IDLs (across subjects) as a function of mean MDTs (across subjects and modulation frequencies) across the entire DR, for low (filled symbols) and high stimulation rates (open symbols). The line shows the linear regression between IDLs and MDTs. Right panel: mean IDLs as a function of mean MDTs for the lower (filled symbols) and upper portions of DR (open symbols). The lines show the linear regressions between IDLs and MDTs for different portions of the DR.
