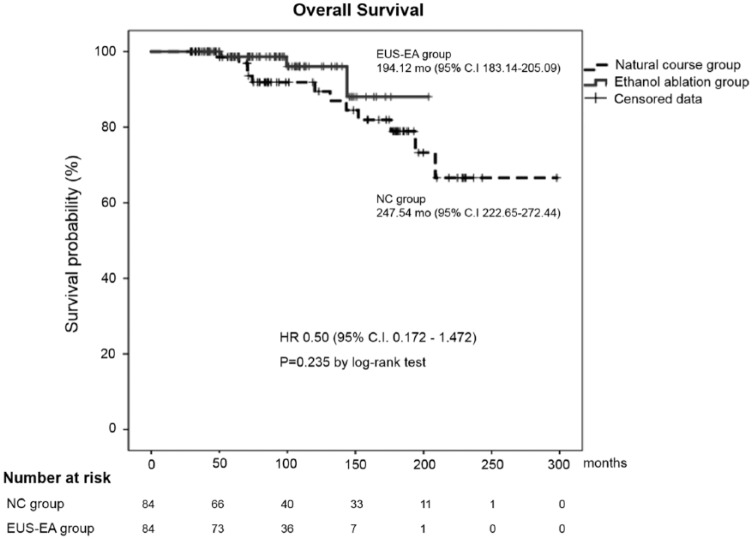
Figure 2.
Kaplan–Meier curve for overall survival in both groups after matching. This graph shows the OS of both groups and there was no statistically significant difference by the log-rank test (194.12 ± 5.60 versus 247.54 ± 12.70 months, p = 0.235).
EUS-EA, endoscopic ultrasound-guided ethanol ablation; NC, natural course.

