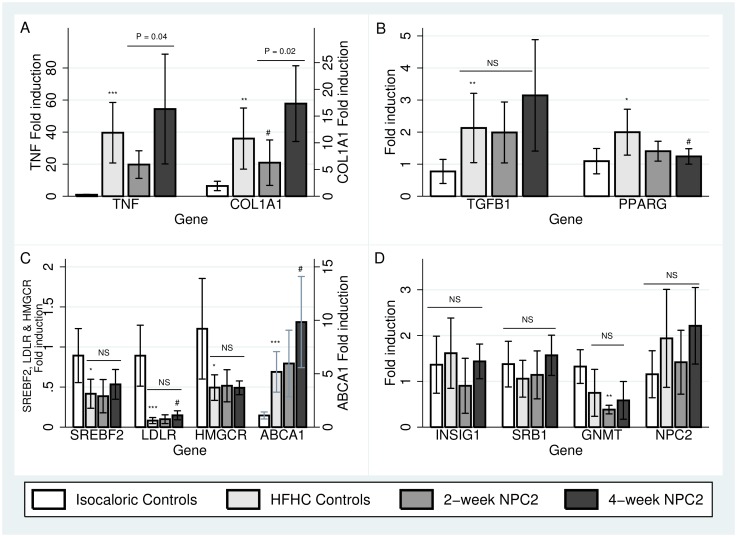
Fig 3. Hepatic gene expression related to inflammation, fibrogenesis and cholesterol metabolism.
Relative mRNA expressions compared with isocaloric diet fed controls of TNF and COL1A1 (Panel A), TGFB1 and PPARG (Panel B), SREBF2, LDLR, HMGCR and ABCA1 (Panel C) and INSIG1, SRB1, GNMT and NPC2 (Panel D) in isocaloric controls, high-fat-high-cholesterol (HFHC) controls, two-week NPC2 (treatment) and four-week NPC2 (prevention) animals. Bars represent median ± interquartile range. *: P < 0.05 compared with Isocaloric Controls. **: P < 0.005 compared with Isocaloric controls. ***: P < 0.0005 compared with Isocaloric controls. #: P< 0.05 compared with HFHC Controls. ¤: P<0.05 compared with two-week NPC2.

