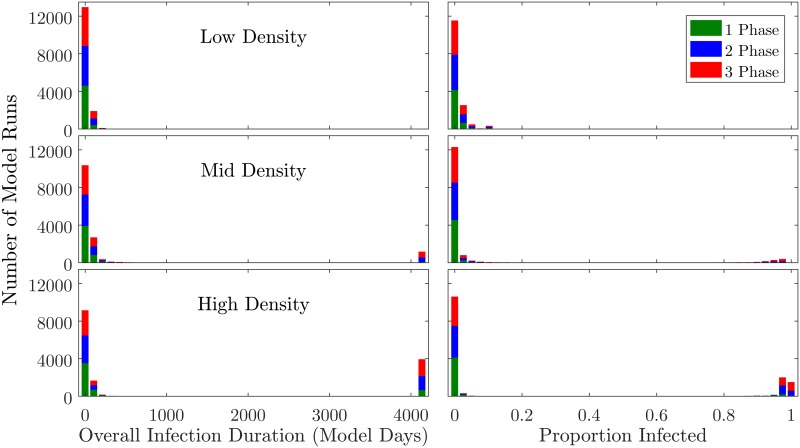
Fig 3. Histograms showing distribution of dependent variables.
Infection duration data appear in the left column and proportion of infected agents in the right column, with color indicating producer specialization level. Low density runs were those with 0 < Np ≤ 500, mid-density 500 < Np ≤ 1000, and high-density 1000 < Np ≤ 1500. Data were split into 40 bins.

