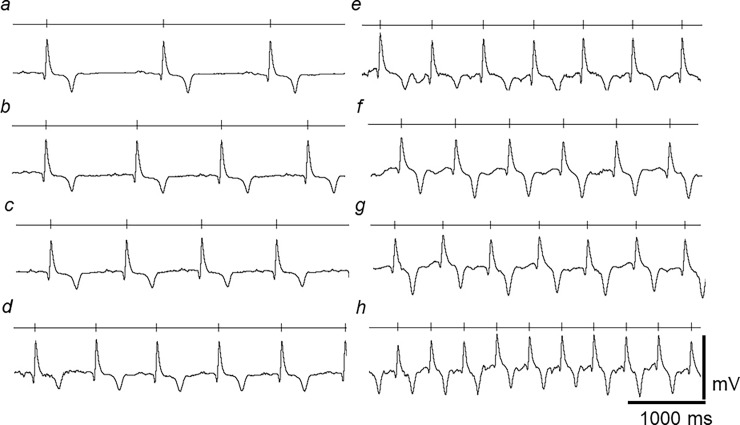
Fig 2. Accommodation of ECG waveform to increasing HRs.
ECG traces obtained through a range of low to high HRs covering the normal physiological spectrum encountered in horses. Each trace is displayed as a rhythm strip; the vertical markers on the horizontal line above trace marks the timing of successive R-waves. The range of HRs within each of trace was (a) 40–45 (b) 51–55 (c) 61–62 (d) 73–76 (e) 89–93 (f) 105–108, (g) 118–120 and (h) 140–145 bpm. (Same horse as shown in Fig 1).

