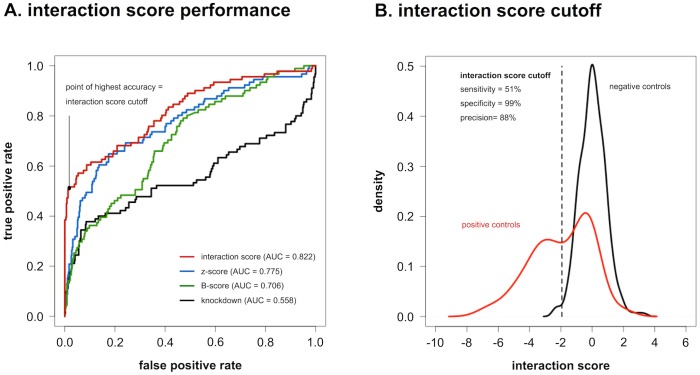
Fig 2. Interaction score performance.
(A) ROC-curve analysis of different metrics for high-throughput screening data-analysis on a set of positive and negative controls in the 3’ UTR reporter screening. Interaction scores and z-scores are calculated as described in the Methods section. B-scores are obtained by applying Tukey median polish to z-scores, in order to remove plate positional bias. Knockdowns are calculated by expressing normalized reporter activities (NRAs) relative to the average NRA of four non-targeting miRNA treated controls in the same assay plate. (B) Distributions of average interaction scores for positive and negative controls are clearly distinct. Application of the interaction score cutoff retrieves positive controls with 51% sensitivity, whereas negative controls are correctly called with a specificity of 99%. Precision obtained with this cutoff (i.e. the proportion of identified interactions that are true interactions) is 88%. Reprinted from Van Peer et al. [37] under a CC-BY 4.0 license, with permission from Oxford University Press, original copyright 2016.

