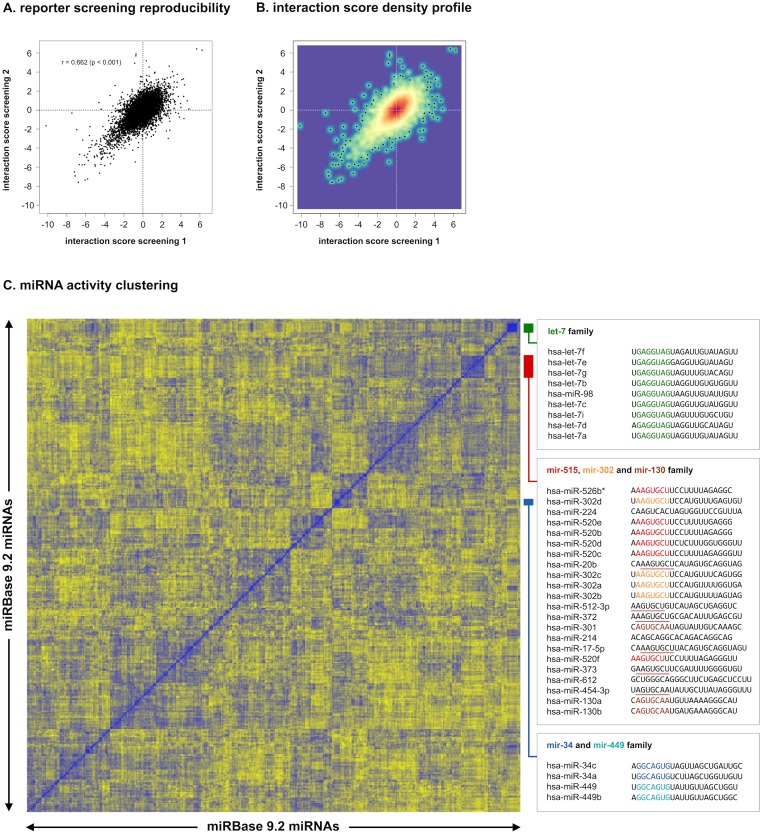
Fig 3. 3’ UTR reporter screening reproducibility.
(A) Correlation of interaction scores from replicate 3’ UTR reporter screenings. (B) Correlation of interaction scores with a density profile, showing that the largest fraction of interaction scores is centered around 0. (C) Hierarchical clustering of miRNAs according to their activity in the 3’ UTR reporter screening. For each miRNA pair, the Pearson correlation between average interaction scores for all 17 cancer genes was calculated. Correlation vectors for all miRNAs are subsequently clustered using Euclidean distance as the distance measure. Members of the same miRNA family, in addition to families with identical or similar seed-sequences, cluster together. For the let-7 family, 9 out of 9 members cluster together. The mir-34 (2 out of 3 members) and the mir-449 family (2 out of 2 members) also cluster together. The only member not clustering (hsa-miR-34b) is the only one having a different, 1-nucleotide offset seed sequence. The mir-302 (4 out of 5 members) and mir-515 family (6 out of 32 members) cluster together with miRNAs with identical or 1-nucleotide offset seed sequences (red underline) such as hsa-miR-20b, hsa-miR-512-3p, hsa-miR-372, hsa-miR-373 and hsa-miR-17-5p. The mir-130 family (3 out of 3 members) clusters together with hsa-miR-454-3p that has an identical seed sequence (brown underline).

