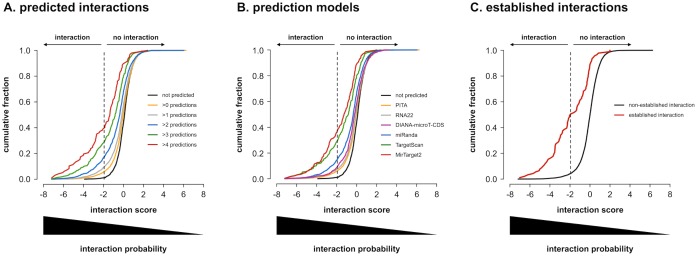
Fig 4. Predicted and established interactions.
Cumulative distributions of average interaction scores for all 7990 miRNA-3’ UTR combinations probed. (A) according to the number of models that predict them as true interactions. Interaction scores are clearly lower for combinations that are predicted by more models. All distributions are significantly different from one another (one-sided Kolmogorov-Smirnov p-values < 0.01 after Benjamini-Hochberg multiple testing correction). (B) according to prediction by individual models. MirTarget2 predictions have the lowest scores. For each model, the distribution of interaction scores for predicted interactions is significantly different from that of non-predicted interactions (one-sided Kolmogorov-Smirnov p-values < 0.01 after Benjamini-Hochberg multiple testing correction). (C) according to whether they have previously been established as true interactions or not. Previously established interactions clearly have lower interaction scores. Distributions are significantly different (one-sided Kolmogorov-Smirnov p-value < 0.001).

