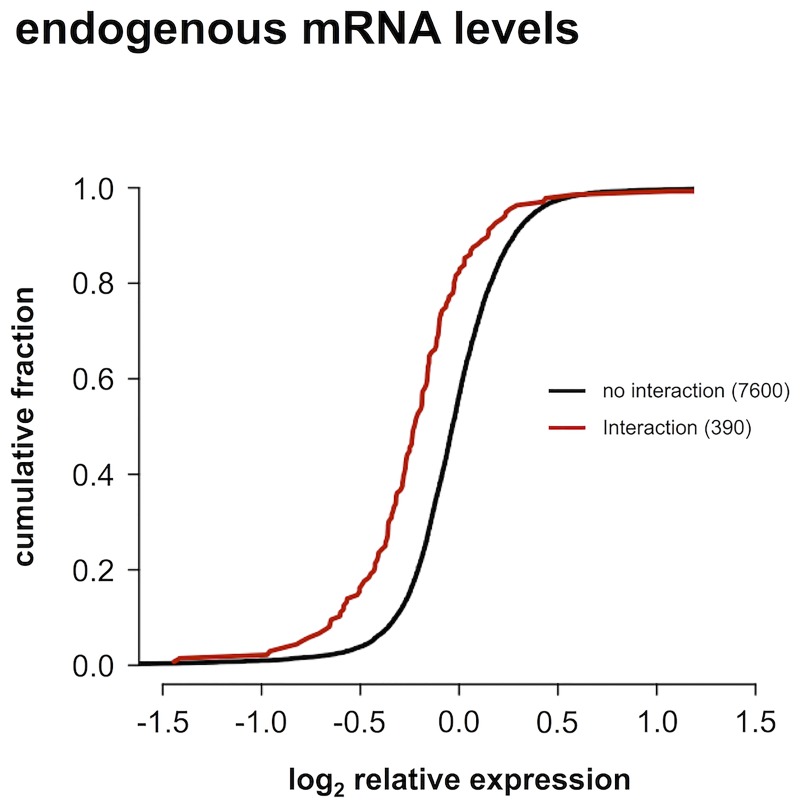
Fig 6. Endogenous mRNA levels.
Cumulative distributions of log2 relative expression levels of endogenous mRNAs measured with RT-qPCR after miRNA modulation. The distribution for interactions identified in the 3’ UTR reporter screening is significantly lower than that for miRNA-3’ UTR combinations for which no interaction was observed (one-sided Kolmogorov-Smirnov p-value < 0.001).

