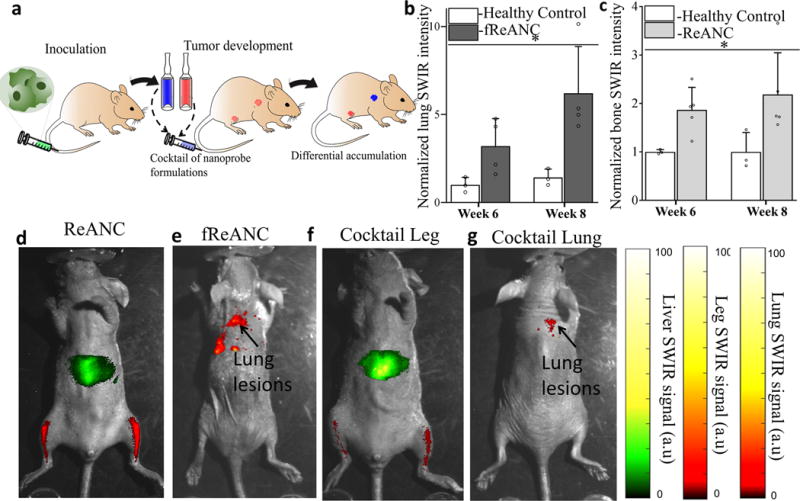
Figure 6. Differential accumulation of ReANCs in leg lesions and fReANCs in lung lesions in a multi-organ metastatic model.

(a) Schematic illustrating intravenous inoculation of MDA-MB-231 cells followed by intravenous administration of a cocktail of nanoprobe formulations and SWIR imaging. Quantitative analysis of SWIR signal shows significantly higher lung intensity compared to healthy controls (b). Representative images show localization of ReANC localization to leg lesions (c); and fReANC localization to lung lesions (d). Representative animal injected with a cocktail of ReANC and fReANC probes showed leg signal (e) and lung signal (f). Data is expressed as mean ± S.D; n=4 for tumor-bearing group and n=3 for healthy control group represented as fold increase compared to healthy control group. *p<0.07, determined by Welch’s t test. SWIR intensities were normalized to those of the healthy control groups for the region of interest at each time point.
