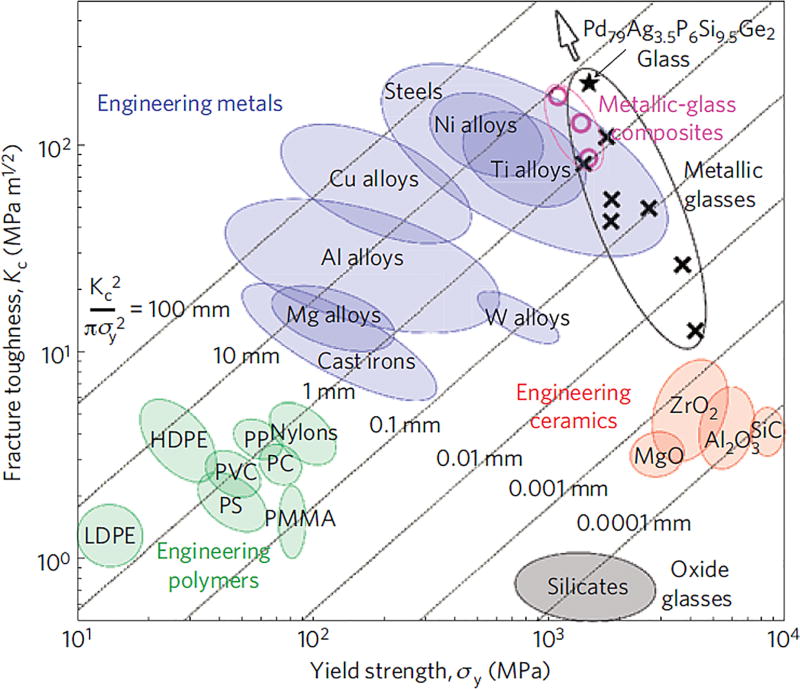
Figure 8.
Ashby map of the damage tolerance (toughness versus strength) of materials. Ranges of fracture toughness versus yield strength are shown for oxide glasses, engineering ceramics, engineering polymers, engineering metals and metallic glasses. Yield-strength data shown for oxide glasses and ceramics represent ideal limits.[99]

