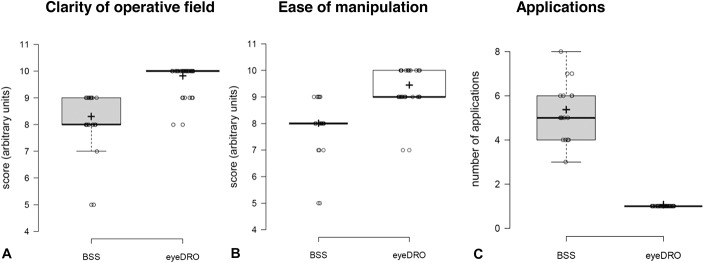
FIGURE 1.
Box plots show the data distribution of intraoperative measurements. (A) Clarity of operative field, (B) ease of manipulation, and (C) the number of applications in eyeDRO- (n = 31) and BSS-treated (n = 20) patients. P < 0.01 for all measured parameters, Mann–Whitney U test between groups, + mean value.

