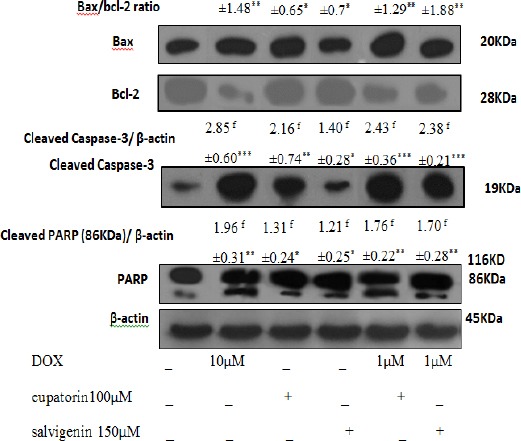
Figure 3.

Effect of Mentioned Treatment on the Levels of Bax/Bcl-2 Ratio, Caspases-3 and PARP Expression on HT-29. Cells were treated as mentioned for 24h. Twenty μg proteins were separated on SDS-PAGE, western blotted, probed with Cell lysates and analysed via the indicated antibodies. Photographs of chemiluminescent detection of the blots, which were representative of three independent experiments, are shown. The relative abundance of each band to its own β-actin was quantified, and the control levels were set. The densities of Bax/Bcl-2 ratio, caspase-3 and PARP bands were measured and the ratio was calculated. The median of three independent experiments is shown. f for fold increase and * Significantly different from control cells (*P<0.05, **P<0.01, ***P<0.001).
