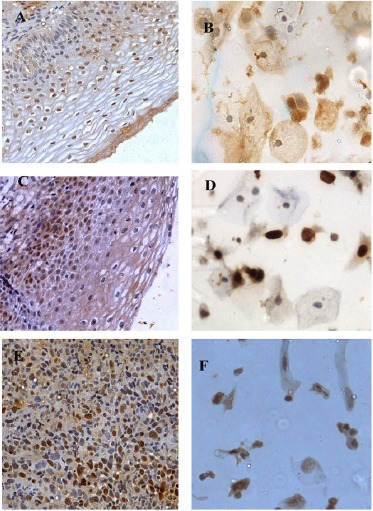
Figure 1.

A-F, Expression patterns of MCM2 in histology and corresponding cytology samples; A and B, LSIL 40(X)- Mild nuclear expression; C and D, HSIL (40X)- Moderate nuclear and mild cytoplasmic expression; E and F, SCC (40X)- Intense nuclear expression.
