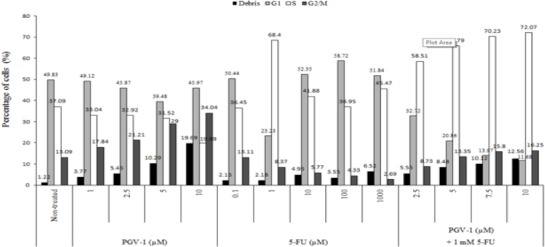
Figure 3.

Cell Cycle Distribution of WiDr Cells after Treatment with 5-FU and PGV-1 for 24h. Cells were treated with various concentrations of PGV-1 and 5-FU and combination of 1 mM of 5-FU and various concentrations of PGV-1 for 24 h and subjected for Flowcytometry. Data was analyzed using Modfit LT software.
