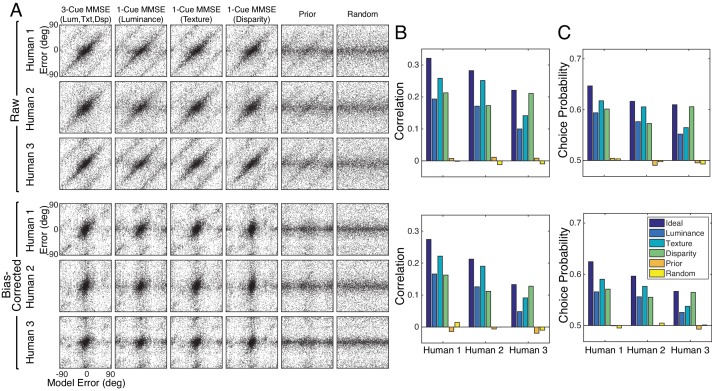
Each model sets its estimates equal to (i) the minimum mean squared error (MMSE) estimates based on three cues (i.e., the normative model used in the main text); (ii–iv) the MMSE estimates based on each single cue alone (Luminance; Texture; and Disparity); (v) random tilt samples from the tilt prior (Prior); and (vi) random tilt samples from a uniform distribution of tilts (Random) (A) Human trial-by-trial errors plotted against the errors made by each of the models. Upper rows show raw errors; lower rows show bias-corrected errors. (B) Circular correlation coefficient for each of the models considered in (A). (C) Choice probability for each of the models considered in (A). Here, we define choice probability as the proportion of trials in which the sign of the model error predicts the sign of the human errors. The pattern is similar to that of the circular correlation coefficient. The MMSE model based on three image cues predicts humans tilt estimation errors better than all other models. In addition to the six models shown here, we assessed a number of ad hoc models. Three single-cue models that set the tilt estimate equal to each of the single cue values (i.e., cue-gradient orientation) predict human performance more poorly than the three-cue normative model used in the main text, but better than the prior or the random model. A model that averages the single-cue values (with equal weights) predicts human estimation better than the single-cue MMSE estimators, but worse than the three-cue normative model used in the main text.


